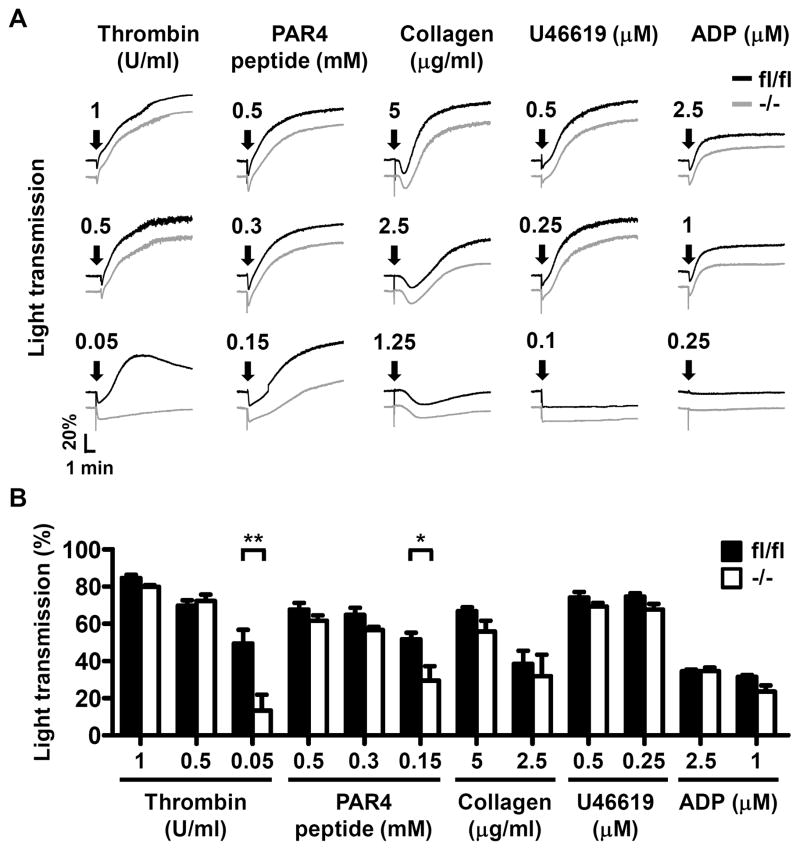
Figure 3.
Selective defects in thrombin-induced aggregation of Dab2−/− platelets. A–B, The washed platelets of fl/fl and −/− mice were stimulated by soluble agonists and platelet aggregation was recorded by a platelet aggregometer (Chrono-Log). Representative aggregation curves in response to thrombin, PAR4 peptide (AYPGKF), collagen, U46619 and ADP at the indicated concentrations were shown in A. Arrows indicate the point of agonist addition. The percentage of light transmission at the end of aggregation assay was shown in B. The data represent the mean ± SEM of 3–9 independent experiments. *, p <0.05 and **, p <0.01.

