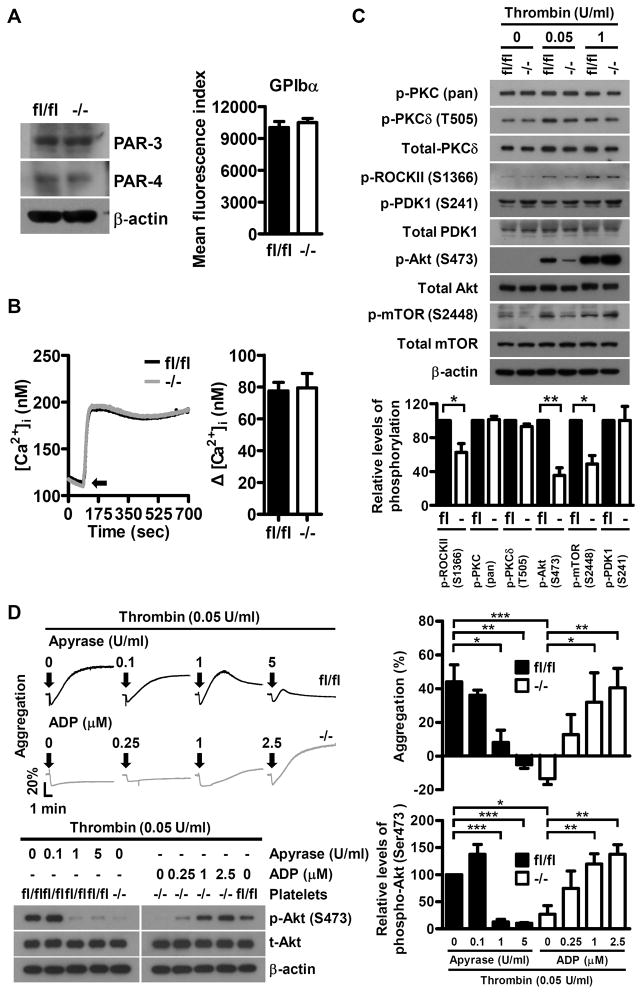
Figure 6.
Dab2 is involved in the regulation of low concentrations thrombin-stimulated ROCKII-Ser1366 and Akt-Ser473 phosphorylation. A, The expression of thrombin receptor GPIbα, PAR3 and PAR4 in fl/fl and −/− platelets was analyzed by flow cytometry or Western blot using FITC-conjugated anti-GPIbα, anti-PAR3 and anti-PAR4 antibodies, respectively. B, Fluo-3-loaded washed platelets from fl/fl and −/− mice were stimulated with 0.05 U/ml thrombin and the changes in intracellular Ca2+ concentration ([Ca2+]i) were calculated. Arrow indicates the starting point of thrombin stimulation (left panel). The data represent the mean ± SEM of 3 independent experiments (right panel). C, The fl/fl and −/− platelets were stimulated with the indicated concentrations of thrombin and the platelet lysates were collected for Western blot analysis using the indicated antibodies. The expression of β-actin was used for the control of equal protein loading (upper panel). The relative levels of phosphorylation for the indicated proteins stimulated with 0.05 U/ml of thrombin were quantified by ImageJ software (lower panel). The data represent the mean ± SEM of 3–4 independent experiments. **, p < 0.01 and *, p < 0.05. D, The fl/fl platelets were pre-incubated with the indicated concentrations of apyrase for 1 min and then stimulated with thrombin (0.05 U/ml). The −/− platelets were stimulated with thrombin (0.05 U/ml) and the indicated concentrations of ADP simultaneously. Platelet aggregation was recorded by a platelet aggregometer (Chrono-Log). Representative traces for platelet aggregation are shown (upper left panel). Arrows indicate the point of agonists addition. The lysates for the platelets with the indicated treatment were collected for Western blot analysis using the anti-Akt and anti-p-Akt (Ser473) antibodies. The expression of β-actin was used for the control of equal protein loading (lower left panel). The percentage of light transmission at the end of the aggregation assay (upper right panel) and the relative phosphorylation levels of p-Akt (Ser473) are shown (lower right panel). The data represent the mean ± SEM of 4 independent experiments. *, p <0.05, **, p <0.01 and ***, p < 0.001.

