
Fig. 2. Changes in mitochondrial membrane potential (Δψm) caused by treatment of cells with the CK2 inhibitor TBB.
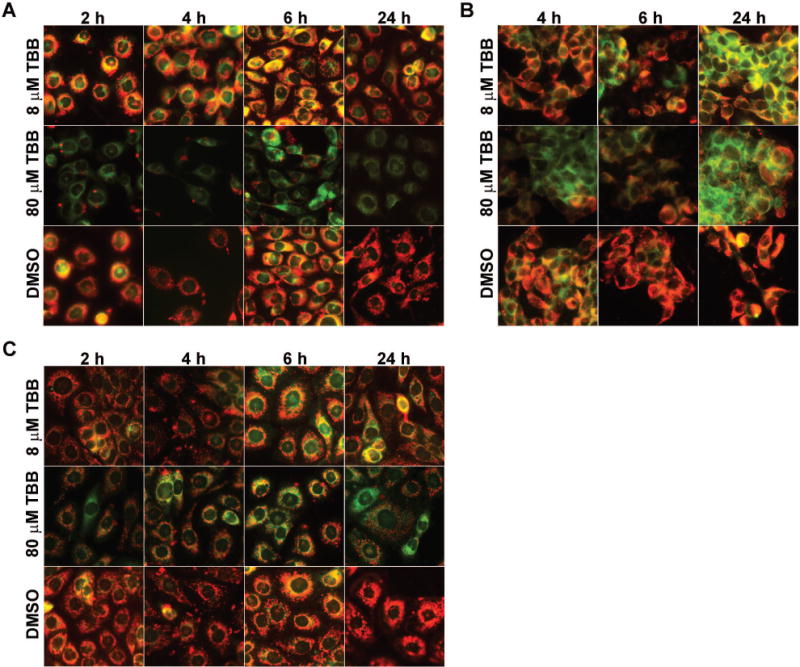
(A) PC3-LN4 cells were treated with 8 or 80 μM TBB as shown. DMSO control cells were treated with a volume of DMSO equivalent to that for 80 μM TBB. The period of treatment varied from 2 to 24 h. (B) LNCaP cells were treated with TBB at 8 or 80 μM for the periods of time varying from 4 to 24 h. (C) BPH-1 cells were treated with 8 or 80 μM TBB for the periods of time varying from 2 to 24 h. Mitochondrial membrane potential was measured using JC-1 as described under Materials and Methods.