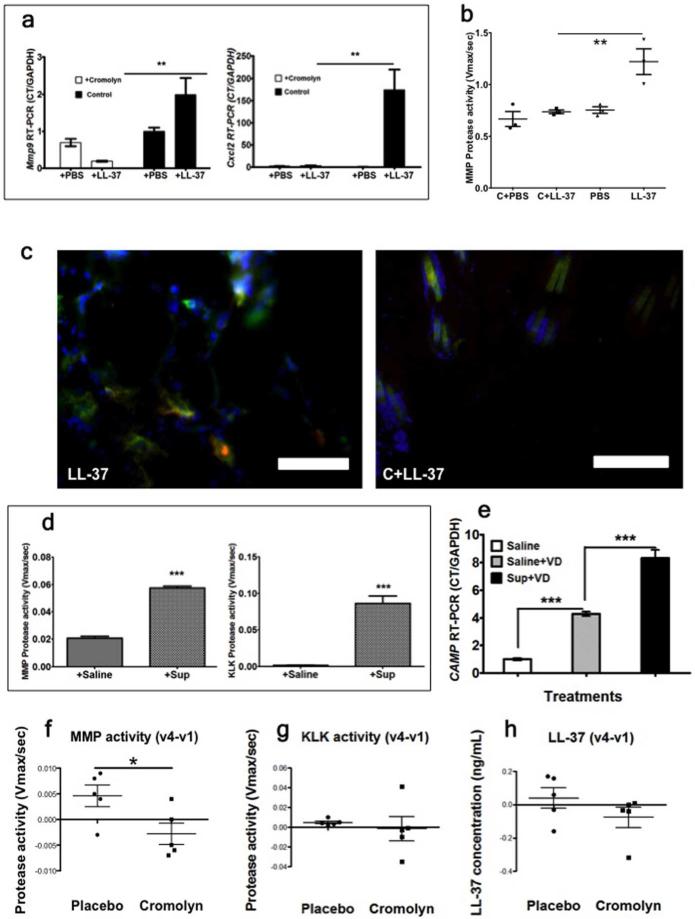
Figure 3. (a-c) Cromolyn treatment of the rosacea-mouse model.
Mice were treated with Cromolyn (C) or Cromolyn and LL-37 (C+LL-37). (a) Skin mRNA expression of mouse metalloprotease 9 (Mmp9) and pro-inflammatory cytokine (Cxcl2). (b) Skin Metalloproteases total activity (MMP activity). (c) Mouse skin immunohistochemistry of mMC-MMP9 contents after LL-37 challenge (left image, LL-37) and cromolyn pre-treatment LL-37-challenge (right image, C+LL-37). MMP-9 (green), FcεRI (Red: MC marker) and DAPI (Blue: cell nuclei). Yellow –orange hue indicates MMP9 and mMC co-localization. Yellow orange color is not present in the right image. Scale bar = 50.0μm. (d-e) MC degranulation increases protease activity in NHEK. (d) MMP and KLK protease activities in NHEK after addition of the product of huMC degranulation in saline buffer (+Sup), or saline buffer (+Saline). (e) RT-PCR Cath LL-37 mRNA (CAMP) expression in NHEK cells treated with the product of huMC degranulation in saline buffer and 1,25(OH)2VD3 (Sup+VD), or saline buffer and 1,25(OH)2VD3 (Saline+VD) and saline alone (Saline); (f-h) Cromolyn effect on protease activity of rosacea patients. (f) MMP activity on the skin of patient treated with placebo (n=5) or cromolyn (n=5) (g) KLK activity. (h) LL-37 peptide level. Statistics: ***p<0.001, **p<0.01, *p<0.05

