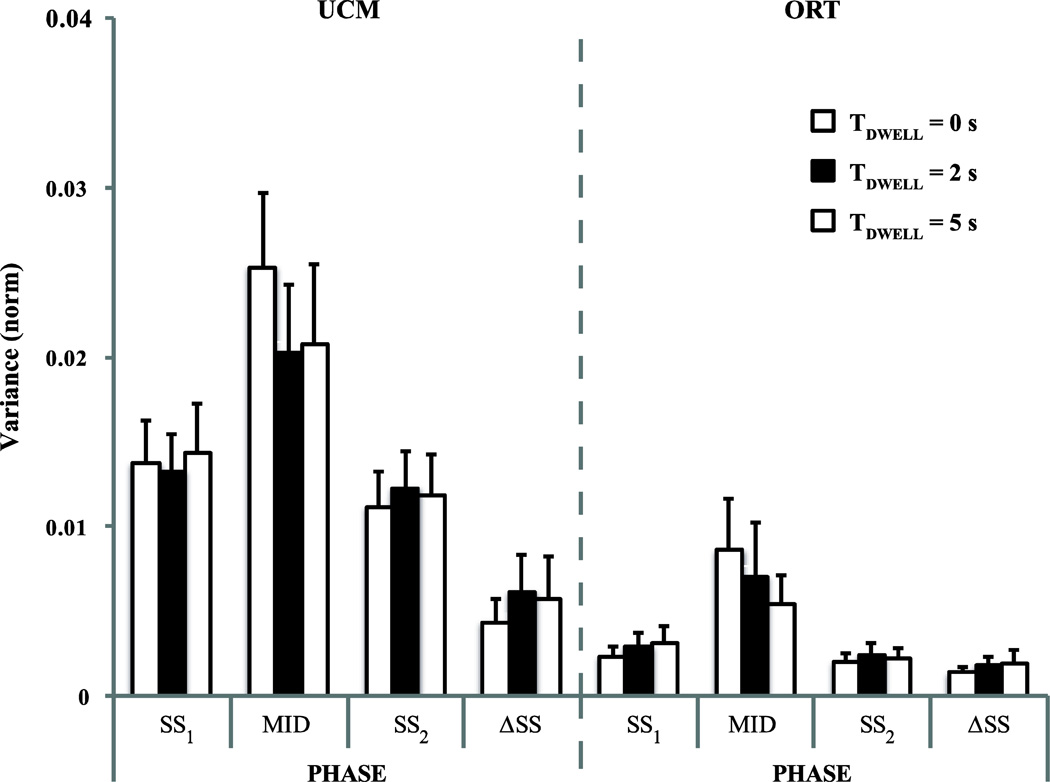
Figure 4.
Variance within the uncontrolled manifold, UCM (VUCM) and within the orthogonal space (VORT) for the SS1, MID, and SS2 phases and for the difference between the two steady states, ΔSS. Means ± SE across subjects are presented. The white, black, and striped bars show the data for TDWELL = 0 s, 2 s, and 5 s conditions, respectively.

