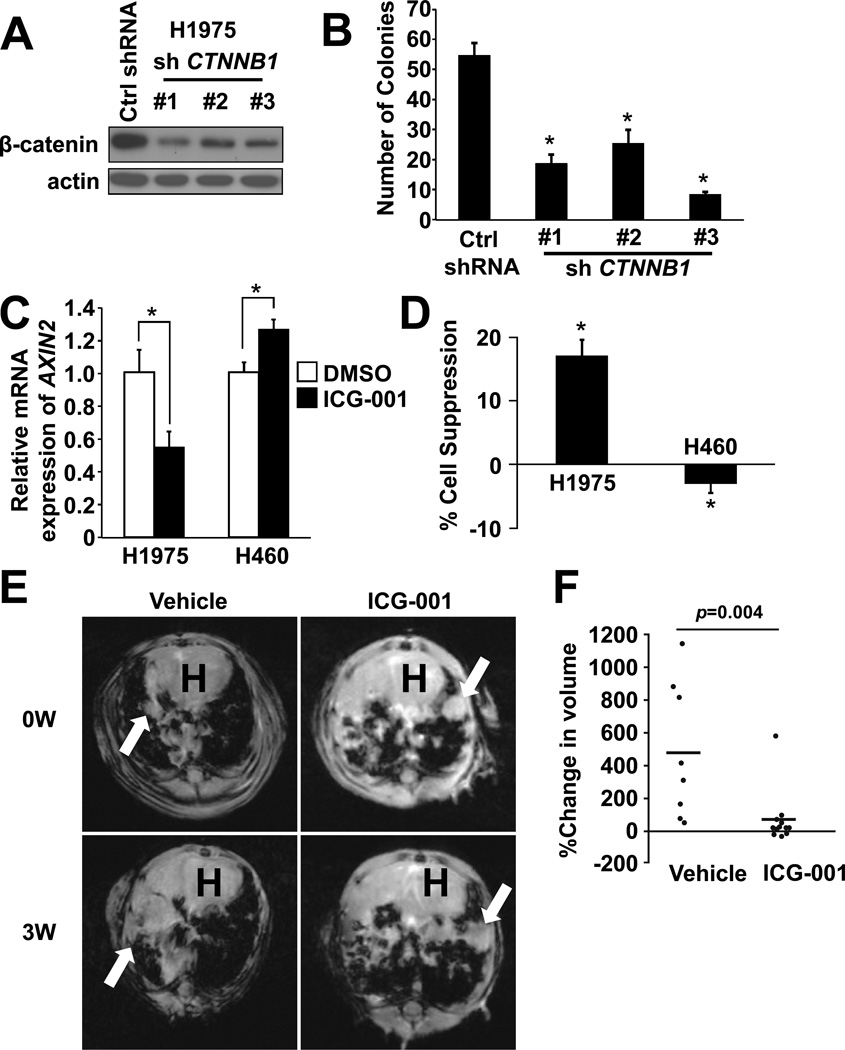
Figure 5. Pharmacological inhibition of β-catenin suppresses tumor growth.
(A) Immunoblots of β-catenin knockdown NCI-H1975. (B) Colony formation assay of β-catenin knockdown NCI-H1975 as described in (A). Colony numbers were counted after 14 days. Data represents mean ± standard deviation from three independent experiments. * indicates p ≤ 0.05. (C) Relative AXIN2 mRNA levels in NCI-H1975 and NCI-H460 cells treated with either 0.1% DMSO or 0.3125 µM ICG-001 were determined by real-time PCR. Data represents mean ± standard deviation from three independent experiments. * indicates p ≤ 0.05. (D) Cell proliferation assay of NCI-H1975 and NCI-H460 cells treated as in (C). Data represents mean ± standard deviation from three independent experiments. * indicates p ≤ 0.05 vs cells treated with 0.1% DMSO. (E) Representative MRI photographs of mice. Mice were treated with doxycycline for 11–15 weeks and treated with either vehicle or ICG-001. Arrows indicate lung tumors. Note that tumor size remained unchanged in mice treated with ICG-001, whereas tumors grew in control mice. “H” indicates location of the heart. (F) Changes in tumor volume were compared to baseline in mice treated with either vehicle (n=8) or ICG-001(n=12). P-value was calculated using Wilcoxon signed-rank test.

