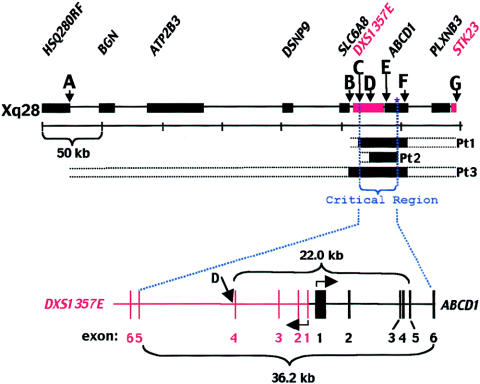
Figure 3.
CADDS critical region, which lies between DXS1357E exon 5 and ABCD1 exon 6. The minimum and maximum extent of Xq28 deletion, on the basis of PCR and Southern blot analyses, is shown for each patient. The black segments denote DNA demonstrated to be absent. The horizontal dotted lines extending from the ends of each box denote regions that have yet to be excluded. An enlargement of the critical region that is missing in all three patients is shown. The smallest deletion occurs in Pt2 and spans 22.0 ⩾ 36.2 kb.

