Figure 2.
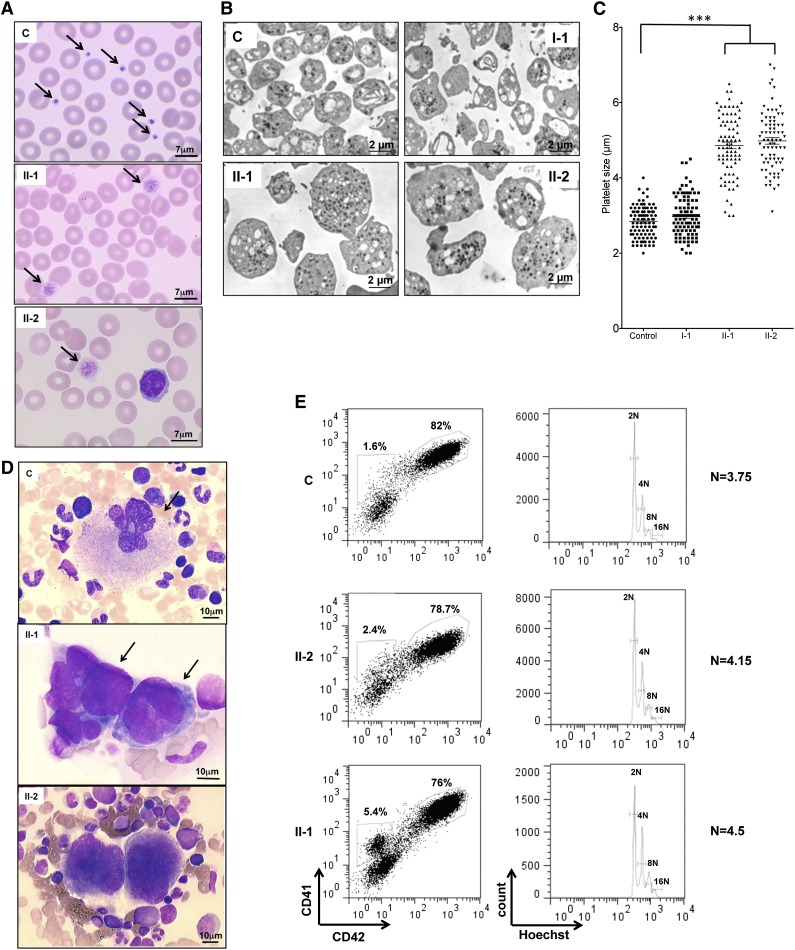
Platelet and MK analysis. (A) Cytological investigation of blood platelets. The black arrows point to platelets in the blood smears. Note the much larger platelet size for patients (II-1 and II-2) compared with control (C). (B) Ultrastructural aspect of blood platelets. Large platelets were detected in blood of II-1 and II-2 patients, and platelets of normal size were detected in 1 control and in a I-1 family member with the heterozygous PRKACG mutation. (C) The size of 100 platelets for control, I-1, II-1, and II-2 individuals was measured. The results represent mean ± SEM. ***P < .0001, unpaired Student t test (2-tailed). (D) Cytological investigations of the bone marrow of II-1 and II-2 patients and control. (E) MK differentiation was induced from control or patient peripheral blood CD34+ cells and analyzed at day 10 of culture. Gates represent mature (CD41+CD42+) or immature (CD41+CD42−) MKs (left). The ploidy level (N) was analyzed in the gate of CD41+CD42+ MKs and was based on the percentage of cells in 8N, 16N, and 32N gates.

