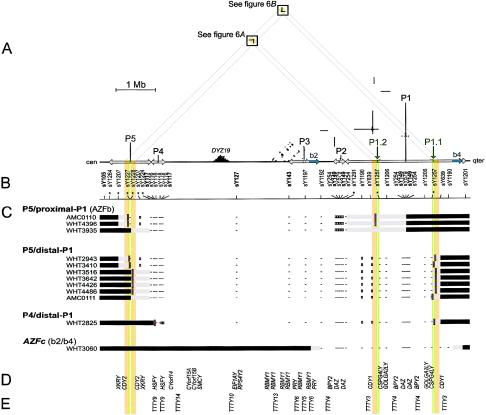
Figure 1.
Deletions between P5 and P1 and between P4 and P1 in relation to the sequence of the Y chromosome. A, Triangular dot plot, encompassing P5, P4, and AZFc (which contains P1, P2, and part of P3). The baseline represents 8 Mb of Y-chromosome long-arm sequence. This triangular display avoids the redundant, artifactual symmetries that would appear in a square self-versus-self plot. Each dot within the plot represents 100 bp of identity between two parts of the Y chromosome in a window of 100 bp. Direct repeats appear as horizontal lines of dots, and inverted repeats appear as vertical lines. Palindromes appear as vertical lines that almost intersect the baseline. Five major palindromes are labeled “P1” through “P5” from right to left, and arrows along the baseline indicate the extents of their inverted-repeat arms. P1.1 and P1.2 are minipalindromes within P1 (see also fig. 6). The arms of P1.1 and P1.2 are too short (10 kb) to be visible at this scale. The “b2” and “b4” direct repeats that bound AZFc are shaded blue on the baseline. Sequences that are homologous between P5 and P1 are shaded orange and green on the baseline. Diagonal gray guide lines connect the P5-P1 homologous sequences on the baseline to the two areas within the plot that contain the corresponding dots. These areas are shaded orange and boxed. The prominent triangle of dots near the baseline and labeled “DYZ19” is a satellite repeat array. B, STSs used for low-resolution breakpoint mapping. Tick marks show STS positions; asterisks indicate new STSs. STSs used in the original definition of AZFb are in boldface. Results for sY1227 and sY1228 are difficult to represent at this scale; see table A1. C, Low-resolution plus/minus STS results and deletion breakpoint positions for 12 men with spermatogenic failure. At the left are the identifiers of the men studied, and to the right of each man’s identifier is a representation of those parts of his Y chromosome that were determined to be present or absent. Horizontal black bars indicate confirmed presence of Y-chromosome DNA, and minuses indicate confirmed absence of Y-chromosome DNA, as assayed by low-resolution STSs. White boxes represent STS positives that were disregarded because of cross-amplifying loci elsewhere and because of negative results for flanking STSs. Horizontal gray bars represent the intervals to which breakpoints were localized by low-resolution breakpoint mapping. (Where STSs fall within gray bars, their results were positive). Short red vertical lines indicate the locations of amplified breakpoint junctions for nine of the patients and, for AMC0111, the 10-kb interval to which high-resolution STS mapping localized the distal breakpoint. AZFc-deleted patient WHT3060 is shown for comparison. D, Genes with significant confirmed or predicted ORFs (see the “Electronic-Database Information” section). E, Spliced but apparently noncoding transcripts (see the “Electronic-Database Information” section).

