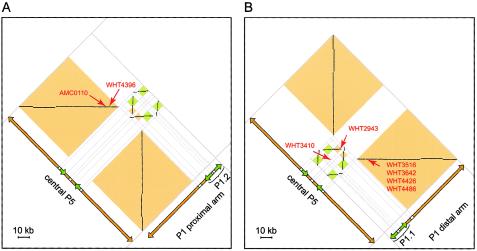
Figure 6.
“High-magnification” dot plots of the two regions of high similarity between P5 and P1 (see fig. 1A). Each dot represents 50 bp of identity in a window of 50 bp. Orientation and orange and green shading is as in figure 1A. A, Central P5 versus P1.2 and the neighboring region of the proximal arm of P1. Locations of the P5/proximal-P1 deletions in AMC0110 and WHT4396 are indicated by red arrows. (The coordinate of a deletion in the plot is the location of the proximal breakpoint paired with the location of the distal breakpoint. Deletions that extend between direct repeats map to horizontal lines of dots.) B, Central P5 versus P1.1 and the neighboring region of the distal arm of P1. Locations of the P5/distal-P1 deletions in WHT2943, WHT3410, WHT3642, WHT3516, WHT4426, and WHT4486 are indicated. WHT3410’s deletion does not extend between homologous sequences and therefore does not map to a line of dots.

