Figure 3.
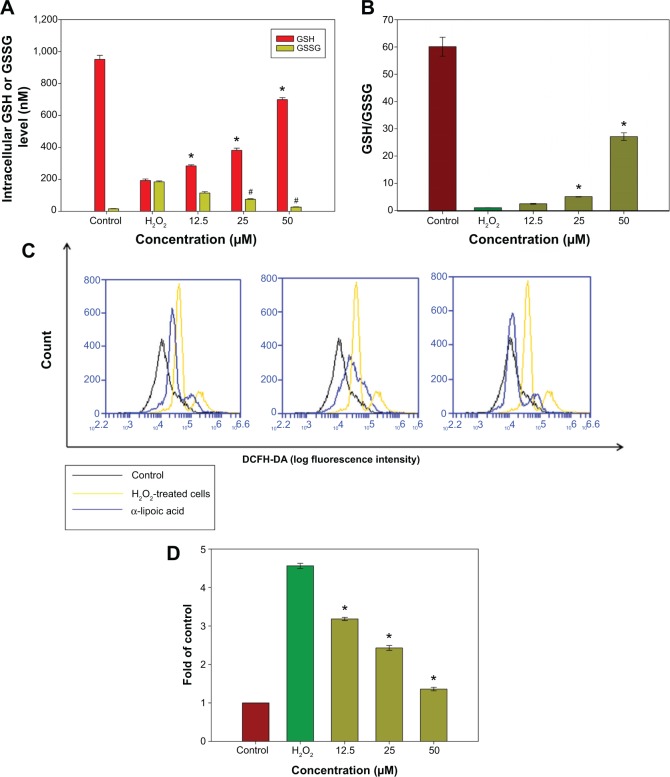
The effect of R-LA on the reduced GSH, GSSG, GSH/GSSG, and ROS levels.
Notes: (A) Pretreatment with R-LA dose-dependently increased the reduced GSH and attenuated the production of the GSSG level following H2O2 exposure. (B) Bar chart shows the GSH/GSSG ratio following the exposure to H2O2 and pretreatment with R-LA. (C) Representative histograms of flow cytometric analysis demonstrating that R-LA reduced the intracellular ROS level (20,000 events were collected for each of the samples). (D) Bar chart shows pretreatment with R-LA dose-dependently reduced intracellular ROS level in NG108-15 cells. Values are means ± standard error and the asterisks indicate significantly different values from the H2O2-treated cells (*P<0.05, n=4).
Abbreviations: DCFH-DA, dichloro-dihydro-fluorescein diacetate; GSH, glutathione; GSSG, glutathione disulfide; R-LA, (R)-(+)-alpha-lipoic acid; ROS, reactive oxygen species.

