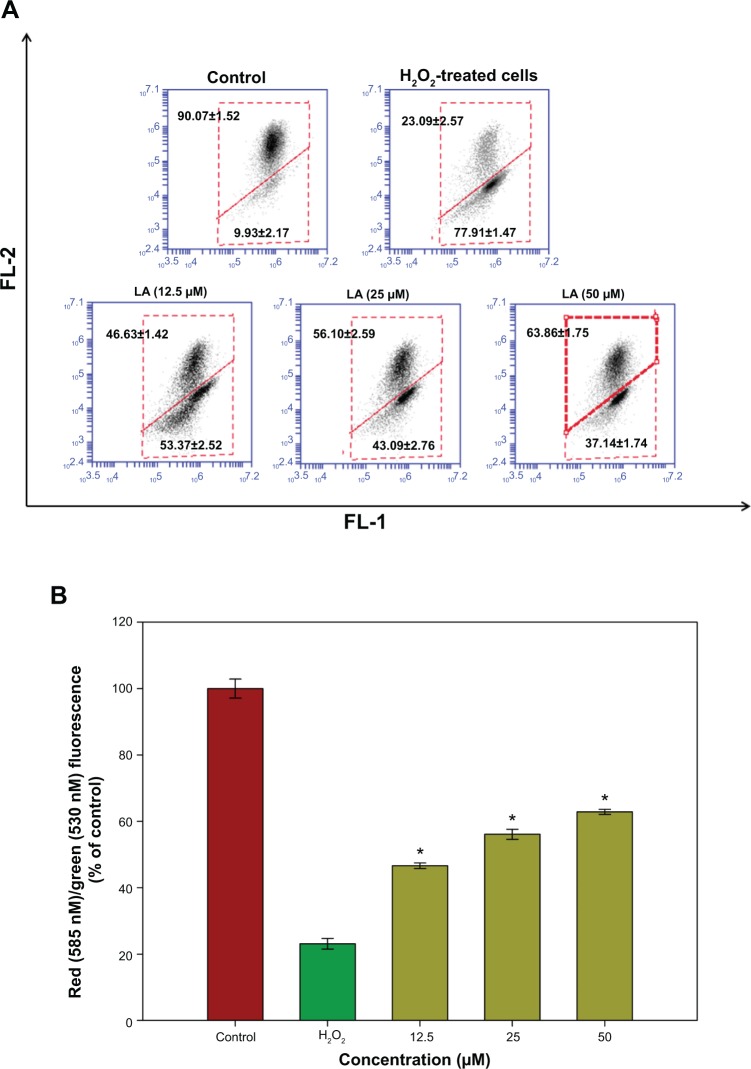
Figure 4.
Flow cytometric analysis of Δψm in NG108-15 cells.
Notes: (A) Representative dot plots of JC-1 aggregates (FL-2 red fluorescence) versus JC-1 monomers (FL-1 green fluorescence). Twenty thousand events were collected for each of the samples. (B) Bar chart showing the percentages of relative fluorescence intensity of Δψm in control, H2O2-only, and varying pretreatment concentrations of R-LA in NG108-15 cells. Values are means ± standard error and the asterisks indicate significantly different values from H2O2-treated cells (*P<0.05, n=4).
Abbreviations: LA, alpha-lipoic acid; R-LA, (R)-(+)-alpha-lipoic acid.

