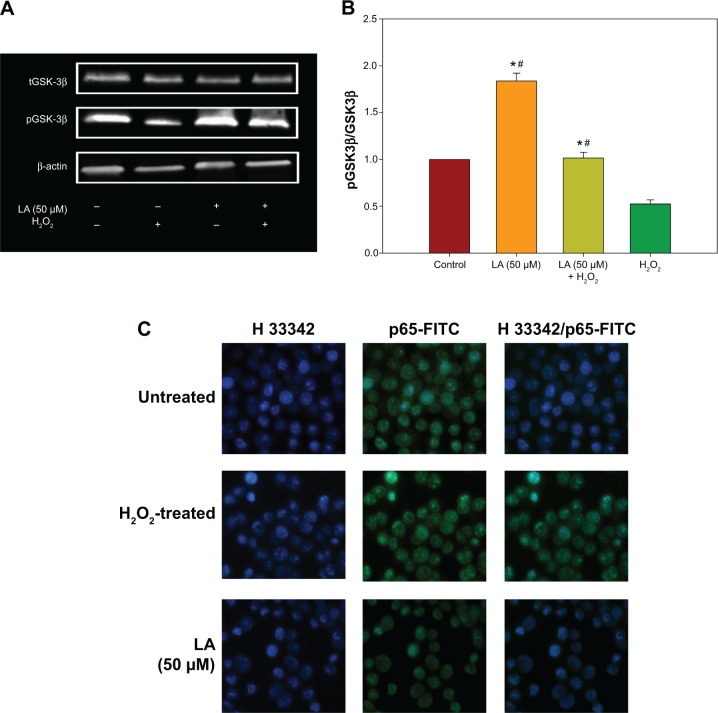
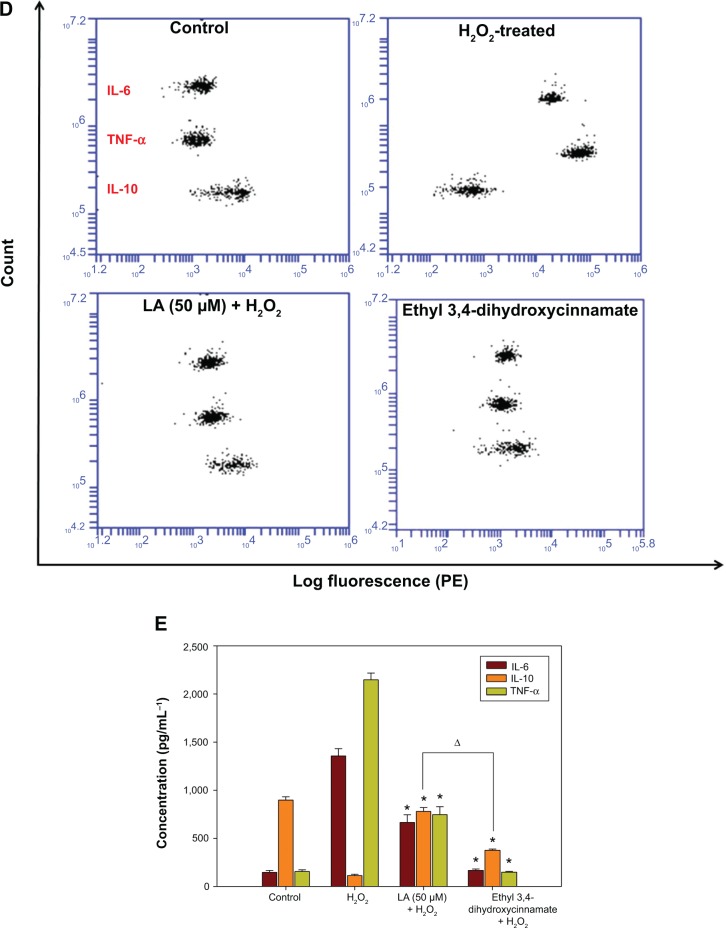
Figure 7.
Western blot analysis of R-LA on pGSK-3β(Ser9) and total GSK-3β and NF-κβ p65 translocation.
Notes: (A) Western blotting: lane 1, DMEM control; lane 2, H2O2 (400 μM); lane 3, R-LA (50 μM); lane 4, (B) pGSK-3β(Ser9)/tGSK-3β ratio. (C) Cells were pretreated with R-LA (50 μM) for 2 hours before H2O2 addition for 4 hours. Cells were stained with H33342 for nuclear visualization (blue) and NF-κβ p65 translocation was visualized by fluorescence microscopy after immunofluorescence staining with anti-NF-κβ p65 antibody and a FITC-labelled anti-rabbit IgG antibody (magnification: 200×). (D) Pretreatment with R-LA (50 μM) and ethyl 3,4-dihydroxycinnamate (10 μM) modulated the cytokine production following H2O2 exposure. Representative flow cytometric dot plots (2,100 events were collected according to BD Biosciences TH1/TH2/TH17 CBA protocol) of TNF-α, IL-6, and IL-10. (E) Bar chart represents the concentration (pg/mL) of TNF-α, IL-6, and IL-10 modulated by R-LA and ethyl 3,4-dihydroxycinnamate following H2O2 exposure after 24 hours. R-LA treatment increased IL-10 significantly as compared to ethyl 3,4-dihydroxycinnamate and H2O2-treated cells. Similar to ethyl 3,4-dihydroxycinnamate, treatment with R-LA suppressed the production of TNF-α and IL-6 as compared to H2O2-treated cells. Values are means ± standard error and the asterisks indicate significantly different values from H2O2-treated cells (*P<0.05, n=4). ΔP<0.05, significantly different as shown.
Abbreviations: DMEM, Dulbecco’s Modified Eagle’s Medium; FITC, fluorescein isothiocyanate; LA, alpha-lipoic acid; PE, phycoerythrin; R-LA, (R)-(+)-alpha-lipoic acid.


