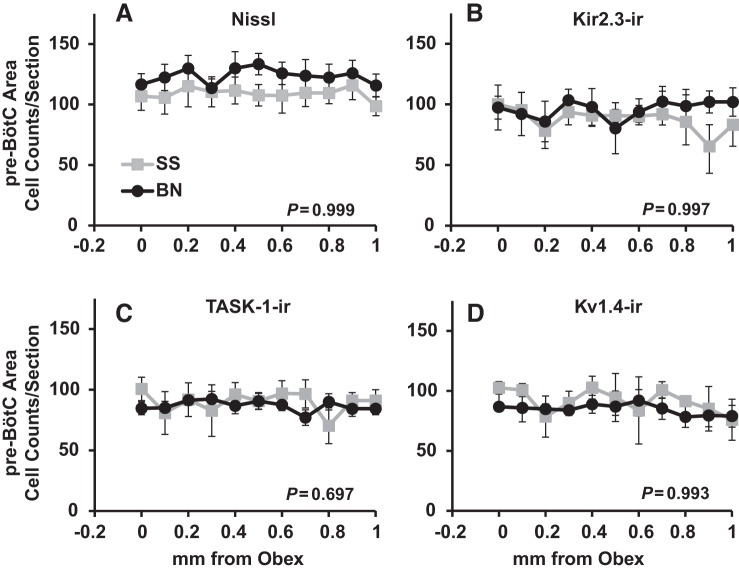
Fig. 3.
Total (Nissl; A), Kir2.3-ir (B), TASK-1-ir (C), and Kv1.4-ir (D) cell counts within the pre-Bötzinger complex (pre-BötC) region did not differ among BN and SS rats. The average (±SE) total, Kir2.3-ir, TASK-1-ir, and Kv1.4-ir cell counts from 0–1 mm rostral to obex are shown for SS (n = 6) and BN (n = 7) male rats. P values included are for the interaction term of two-way ANOVA (strain × caudal-rostral distance).

