
Fig. 10.
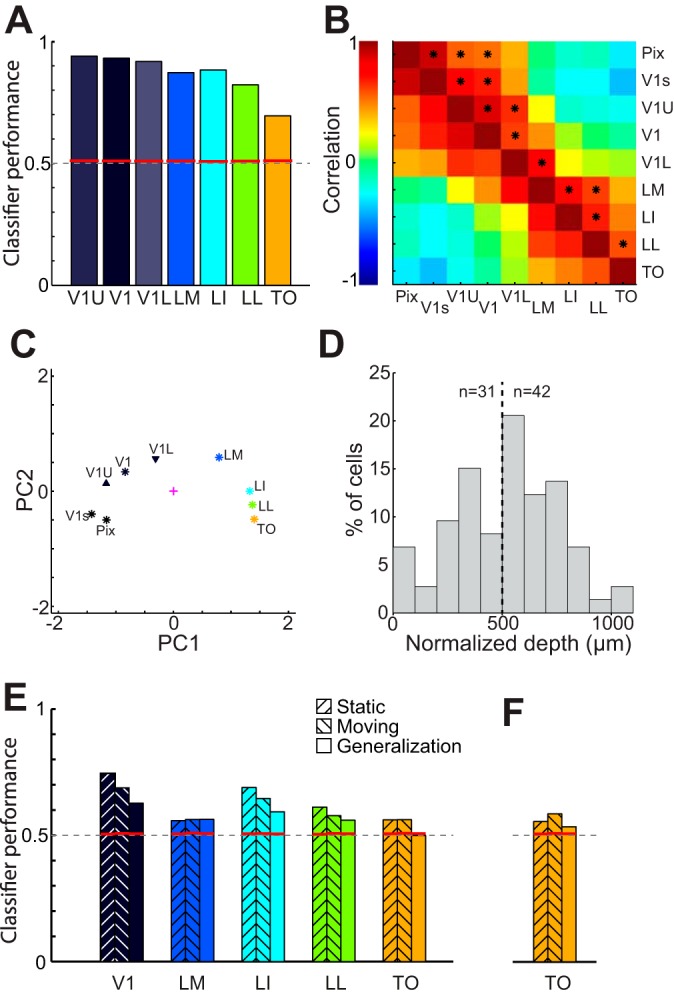
Gradual change in information readout over different areas. A: SVM classifier pairwise discrimination performance (averaged across 15 shape pairs) per area, including upper and lower layers of V1 (V1U and V1L). Red lines indicate significance levels obtained through permutations. Dashed line indicates chance level. B: correlation matrix based on dissimilarity scores for 15 shape pairs based on physical stimulus properties (Pix and V1s) and neural responses (in areas V1, LM, LI, LL, and TO and V1U and V1L). C: plot of the first 2 principal components computed for the correlation matrix shown in B. This representation indicates that upper layers of V1 are more similar to physical measures; lower layers code the shapes more like area LM, downstream to V1. D: depth distribution of neurons in orthogonal V1 penetrations for units used in V1U and V1L. Depth is normalized for small differences in electrode tilt. Dashed line indicates division between upper (V1U; left) and lower (V1L; right) layers. E: SVM classifier discrimination performance averaged over 15 shape pairs per area using the initial peak response (41–240 ms after stimulus onset) only. Left bars show discrimination performance for static stimuli, center bars show discrimination performance for moving stimuli, and right bars show the classifier generalization from static to moving stimuli, obtained after training the SVM classifier on responses to static shapes and testing this classifier on responses to the moving shape. Red lines indicate significance levels obtained through permutations. Dashed line indicates chance level. There is significant generalization from static to moving stimuli in all areas except for TO. In F we show the same generalization data for TO, but here only the responses in a 60-ms interval around the population PSTH peak were used. Significant generalization was observed.