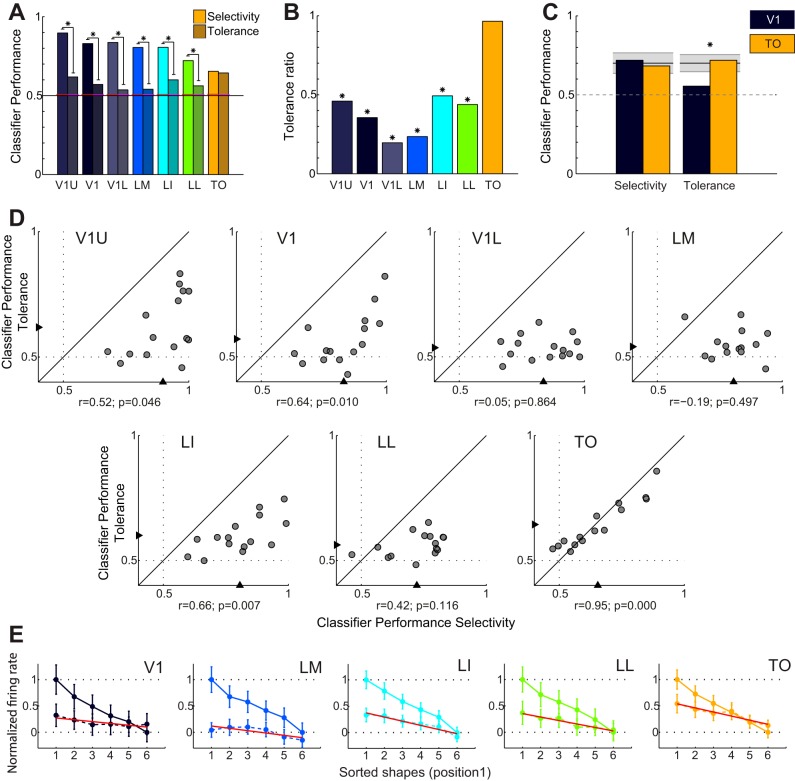
Fig. 11.
Comparison between selectivity and tolerance. A: selectivity (colored bars, left) and tolerance (shaded bars, right) SVM classifier performance for V1, LM, LI, LL, and TO and V1U and V1L. Red lines indicate significance threshold based on permutations; asterisks indicate significant differences between selectivity and tolerance for the same area. B: ratio between selectivity and tolerance (data shown in A) for the same areas. The ratios are corrected for chance performance obtained when guessing. *Ratios differ significantly from 1. C: selectivity and tolerance SVM performance in V1 and TO for the subset of neurons that was equated for selectivity. Also in this subset there is a significantly higher tolerance in TO compared with V1. Black lines indicate average performance after shuffling area labels, and the gray area indicates the 95% confidence interval. *The observed difference between V1 and TO exceeds what is expected by chance. D: scatterplots of selectivity and tolerance SVM performance of all shape pairs. Triangles indicate mean SVM classifier performances as shown in A. E: single-unit measures of selectivity and tolerance. For different areas, the neural responses at both positions are shown, sorted according to preference at the first (most responsive) position (solid line). Responses of each population of neurons were normalized to have an average 1 for the best and 0 for the worst shapes at this position. Responses at the second position, sorted and normalized according to the responses at the first position, are indicated with a dashed line. Red lines show a linear fit through the data points for the second position.

