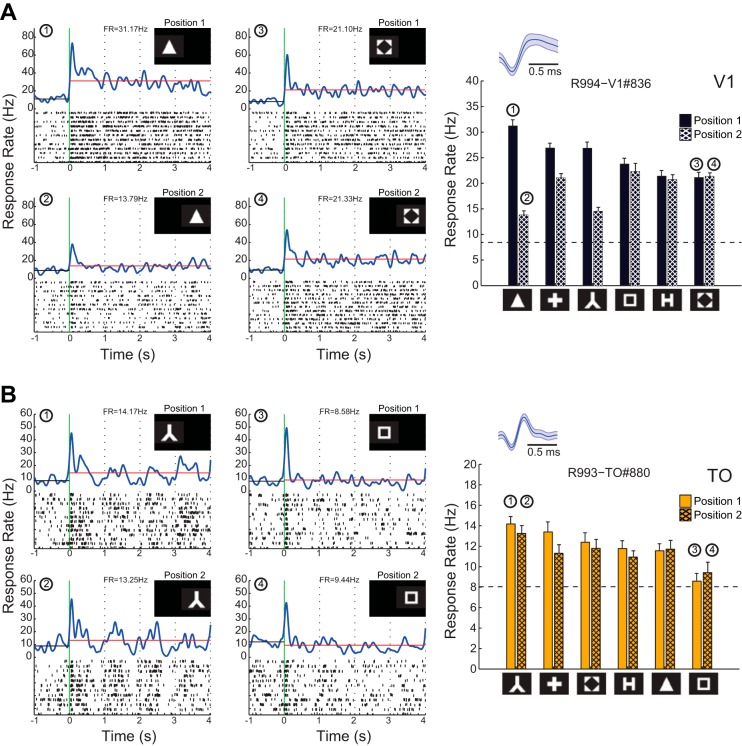
Fig. 7.
Responses of 2 representative neurons from V1 (A) and TO (B) to moving shapes at 2 different positions. PSTH and raster plots are shown on left for the shapes with the highest and lowest responses at the first position (top) and the same shapes at the second position (bottom). Horizontal black lines indicate average baseline firing rate (1 s preceding stimulus onset); horizontal red lines indicate average firing rate during the 4-s interval after stimulus onset. Right: net mean response rates for all shapes at the first and second stimulus positions. Both neurons show selectivity at the best position, but only in TO do we observe tolerance for position. Insets: mean spike waveforms.

