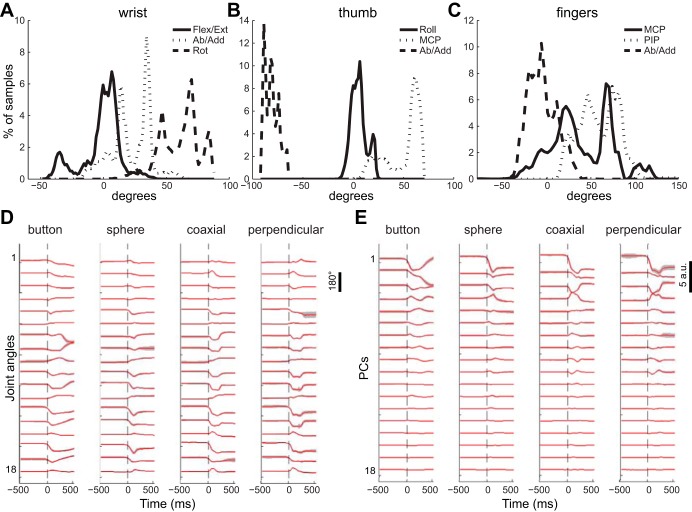
Fig. 3.
Distributions of joint angle data. Hand movements entailed substantial variation in each of the joint angles, as illustrated in these histograms: wrist angles (A), thumb angles (B), and finger angles (C). Data for each type of joint in C have been pooled across the four fingers: I, M, R and L. Data shown in A, B and C have been pooled across both sessions and all trials from monkey X. D: the time course of angular position at each joint averaged across all successful trials for each peripheral object from session X0918. The calibration bar at right indicates 180°. E: the time course of motion along the 18 principal components (PCs) derived from these joint angles. Because the PCs are dimensionless, the calibration bar is in arbitrary units (a.u.). Data in D and E all were aligned at the onset of movement (dashed vertical lines at time 0). Red traces indicate the mean across all successful trials of each type; gray shading indicates ± 1 SD. Flex/Ext, flexion/extension; Ab/Add, abduction/adduction; Rot, rotation; MCP, metacarpophalangeal; PIP, proximal interphalangeal.

