
Fig. 6.
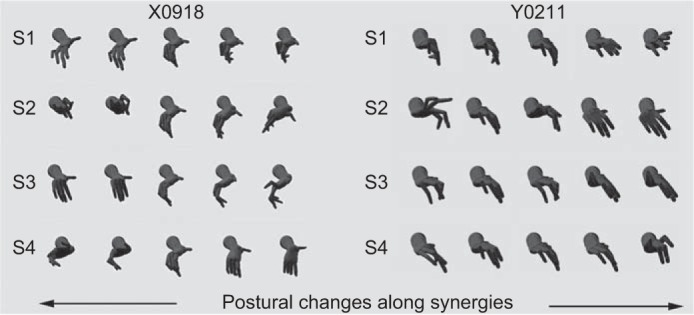
Kinematic synergies identified with PC analysis. For one session from monkey X (left) and one from monkey Y (right), the first four kinematic synergies (S1–S4) are illustrated as variations in hand postures. Each row shows five hand postures sampled along the indicated synergy. On average, the first four synergies accounted for 90% of the data variance across all data sets (see Fig. 5). The three-dimensional model of a Rhesus monkey's hand used to illustrate these postures was generated and rendered in the Musculo-Skeletal Modeling System provided courtesy of Davoodi and Loeb (2012) with permission.