
Fig. 8.
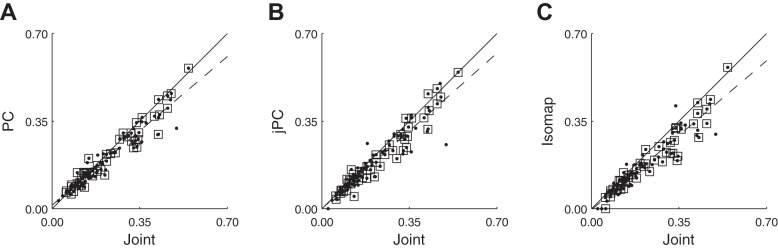
Maximal absolute cross-correlations with joint DoFs vs. PCs, jPCs, or isomap dimensions. A: in this scatterplot using data from session Y0304, each point represents a spike recording plotted at the coordinates of its MAXC with any joint (abscissa) vs. its MAXC with any PC (ordinate). B: a similar scatterplot using data from the same session, but now the ordinate represents the MAXC with any jPC. C: a similar scatterplot for isomap dimensions. In all three frames, points representing SUs have been marked with open squares; other points represent MU recordings. The solid line has unity slope, and the dashed line is the linear regression best fit to the data (SUs + MUs).