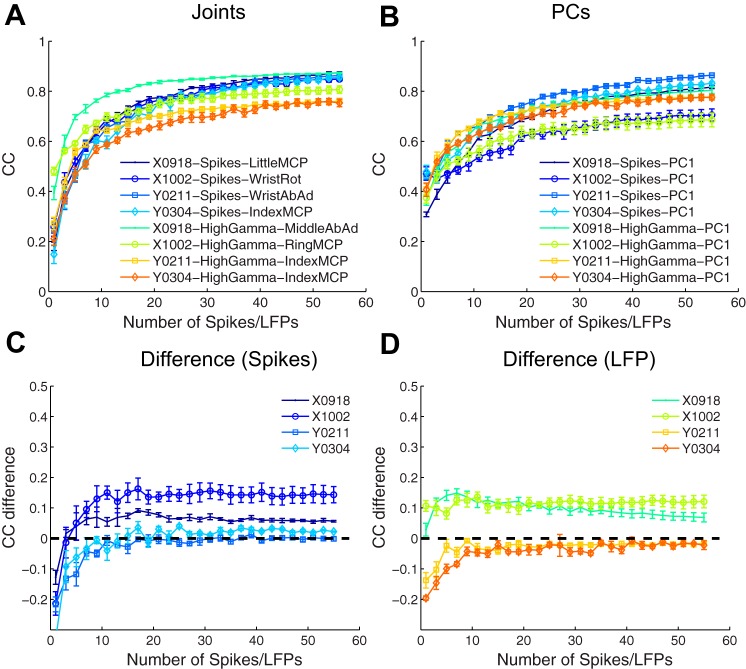
Fig. 9.
Prediction of original joint angles and their PCs from neurophysiological signals. Decoding accuracy of the best decoded joint DoF (A) and best decoded PC (B) in each session is shown as a function of the number of features used for spike recordings (including both SUs and MUs) and for local field potential (LFP) power in the 100- to 170-Hz band. Decoding accuracy has been quantified as the correlation coefficient (CC) between the actual and predicted parameters. Error bars represent SDs across 5-fold cross-validation of each point. LFP power in the 100- to 170-Hz band (High Gamma) generally provided higher CCs than LFP power in the remaining bands or LFP amplitude, and hence LFP decoding results are shown only for this band. The curve for the best decoded PC has been subtracted from that for the best decoded joint DoF in each session separately for spike recordings (C) and high-gamma LFP power (D). Note the expanded scale of the ordinate in C and D.

