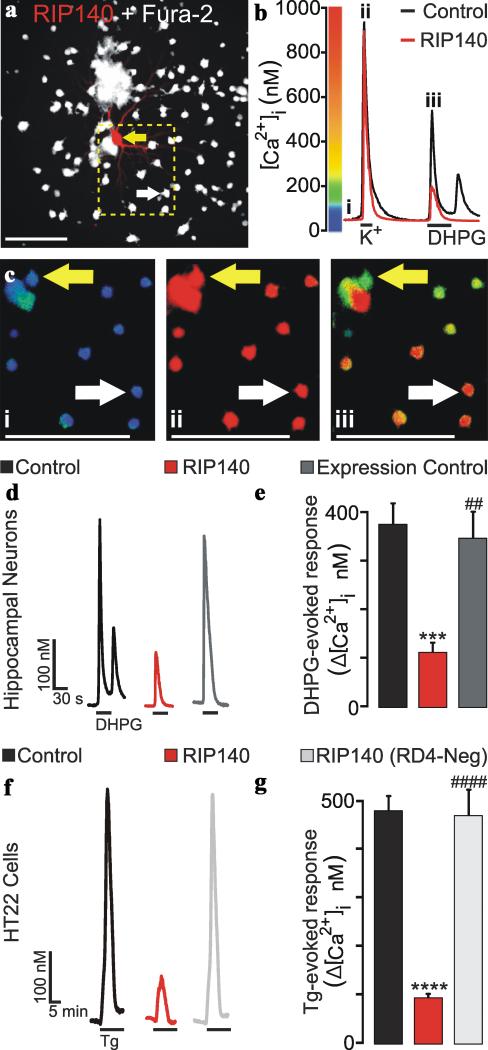
Fig. 4. RIP140 attenuates ER Ca2+ release in neurons.
[Ca2+]i was recorded using fura-2-based digital imaging (Methods). A, Representative image (n = 1 of 8) shows a neuron expressing RIP140 ( ) and DsRed2 in a field of neurons loaded with fura-2 (
 ) (scale bar = 100 μm). Neuronal processes are not visible in the fura-2 image because it was focused to the center of the soma above the focal plane of the dendrites. B, representative trace shows [Ca2+]i for the non-expressing (
 ) and RIP140-expressing (
 ) neurons identified by the arrows in A. Neurons were superfused with 50 mM K+ and 30 μM DHPG at the times indicated by the horizontal bars in B. C, pseudocolor images were scaled as shown in B. Images were collected at the times indicated by the lowercase numerals annotating the traces in B. D, representative traces show DHPG-evoked Ca2+ release from non-expressing neurons (
 ) and neurons expressing DsRed2 (
 ) or RIP140 (
 ). E, Bar graph shows net [Ca2+]i increase evoked by DHPG in non-expressing neurons (
 ) and neurons expressing DsRed2 (
 ) or RIP140 (
 ). ***p<0.001 relative to non-expressing control; ##p<0.01 relative to RIP140 as determined by one-way ANOVA with 3 levels followed by Tukey's post test for multiple comparisons. E, representative traces show Ca2+ release evoked by 1 μM thapsigargin from non-expressing (
 ) HT22 cells and from HT22 cells expressing RIP140 (
 ) or RIP140 (RD4-neg) (
 ). F, Bar graph shows net [Ca2+]i increase evoked by Tg in non-expressing (
 ) HT22 cells and HT22 cells expressing RIP140 (
 ) or RIP140(RD4-neg) (
 ). ****p<0.0001 relative to control; ####p<0.0001 relative to RIP140 as determined by one-way ANOVA with 3 levels followed by Tukey's post test for multiple comparisons.

