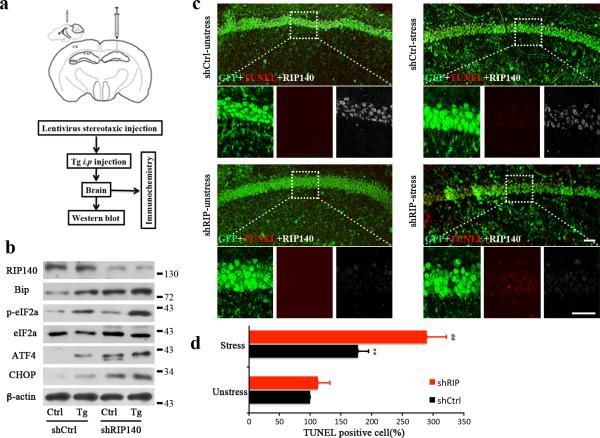
Figure 7. RIP140 protects cells from ER stress in mouse brain.
a, Cartoon depicting the site of Lentiviral injection and the experimental procedure. b, Western blot analyses of RIP140 and ER stress related proteins Bip, p-eIF2a, ATF4 and CHOP in the virus-injected brain area 5 days after injection with lentivirus-ShRIP140 (Lenti-ShRIP140) or Lentivirus-control (Lenti-Ctrl). c, TUNEL staining (red puncta) of brain sections from the Lentivirus-infected areas 20 days after virus injection (2 days post stress induction). DAPI (blue) depicts nuclear staining and green signals show Lentivirus-infected cells. Scale bars, 20μm. d, Bar graph shows the percentage of TUNEL-positive cells versus total cell number from same field. The results from five different fields in each group are presented as means ± SEM., **p<0.01 compare to unstressed group; ##p < 0.01 relative to stressed Lenti-Ctrl group as determined by one-way ANOVA.

