
FIG. 1.
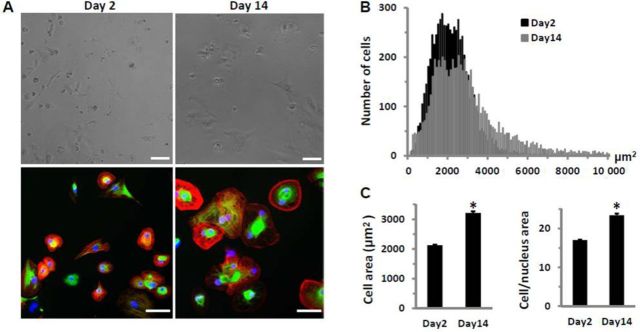
HiPSC-CMs in culture for 2 or 14 days after plating. (A) Microscopic images before fixation (top) and after, stained (bottom) for cTnI (red), myomesin (green), and nuclei (blue), demonstrate hypertrophic growth of hiPSC-CMs in culture. Bar represents 60μM. (B) Frequency distribution of cell surface area based on cTnI-stained cells (n > 6000 cells each from Day 2 and Day 14 cultures) shows an increased cell population with larger cell size in Day 14 cultures. (C) Comparison of cell surface area and the ratio of cell/nuclear area of cTnI-stained cells from Day 2 or Day 14 cultures. Each bar represents the mean ± SE of 20 wells. *p < 0.05 versus Day 2.