
FIG. 2.
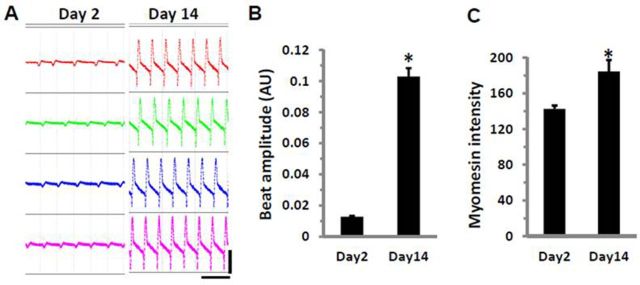
Enhancement of contractile properties in cultured hiPSC-CMs. (A) Screenshots of spontaneous beating cells taken from the same four wells on Day 2 and Day 14. Horizontal scale bar represents 3 s; vertical scale bar represents 0.06 arbitrary units (AU). (B) Comparison of beat amplitude and (C) myomesin staining intensity in cells from Day 2 or Day 14 cultures. Each bar represents the mean ± SE of 32 (B) or 20 (C) wells. *p < 0.05 versus Day 2.