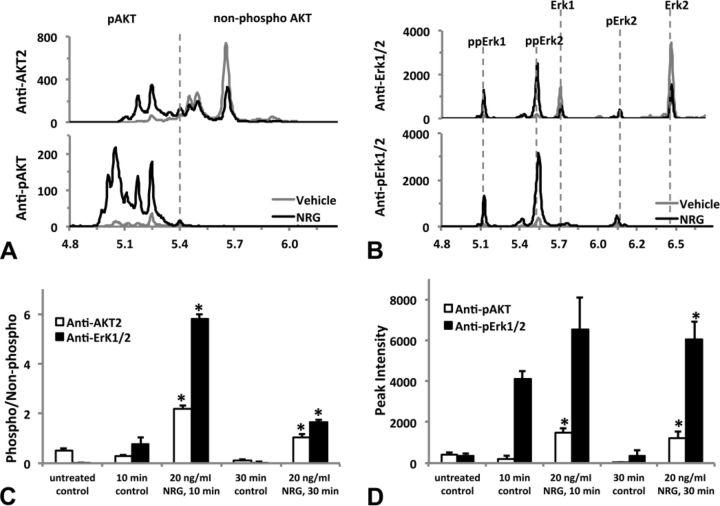
FIG. 7.
Activation of multiple phosphorylation isoforms of AKT and Erk1/2 by neuregulin-1β (NRG). HiPSC-CMs were treated (or untreated) with fresh medium (time-matched vehicle control) or NRG 20 ng/ml (diluted in the fresh medium) for 10 or 30 min before lysed as described in the Materials and Methods section. Lysates were analyzed by the nanofluidic proteomic immunoassay (NIA) using antibodies raised against either the total protein or specific phosphorylated-site of AKT and Erk1/2. (A) Representative traces of nanofluidic proteomic immunoassay (NIA) analysis of 30-min treatment samples using anti-AKT2 or anti-pAKT(Ser473) to detect the non-phosphorylated or phosphorylated AKT. The vertical dashed line separates peaks of phosphorylated (pI < 5.40) or non-phosphorylated (pI > 5.40) ATK. Note the leftward shift and dramatic increases in phosphorylated peaks after NRG treatment. (B) Representative traces of NIA analysis of 30-min treatment samples using anti-Erk1/2 or anti-pErk/12(Thr202/Tyr204) to detect the non-phosphorylated or phosphorylated Erk1/2. Isoelectric peaks corresponding to the non-phosphorylated Erk1/2 and their mono- or dual-phosphorylated isoforms (pErk1/2 or ppErk1/2) are marked with vertical dashed lines. NRG treatment reduces the non-phosphorylated peak intensity of Erk1 and Erk2 and increases the peak intensity of phosphorylated isoforms, especially ppErk1 and ppErk2. The level of phosphorylation for AKT or Erk1/2 is quantified by either the phospho-/non-phosphorylated peak intensity ratio (C), or by the peak intensity of all phosphorylated isoform peaks (D). Each data represents the mean ± SE of three independent experiments. *p < 0.05 versus the time-matched control group. Isoelectric point (pI) is shown on the x-axis and chemiluminescence on the y-axis in (A) and (B).

