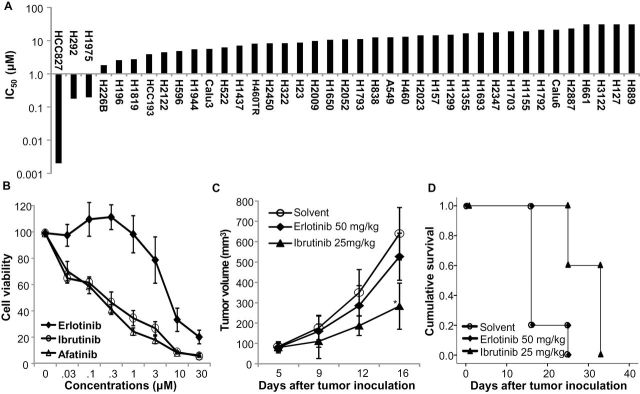
Figure 1.

Antitumor activities of ibrutinib in non–small cell lung cancer (NSCLC) cell lines. A) Calculated 50% inhibitory concentration (IC50) on a logarithmic scale for 39 NSCLC cell lines. B) Dose–response curves of erlotinib, afatinib, and ibrutinib for the H1975 cell line, which has a T790M mutation. The data are means with standard deviations for two assays done in quadruplicate. The viability of control cells treated with dimethyl sulfoxide was assigned a value of 100. C) In vivo growth of H1795 tumors. The mice were treated as indicated. The values are means ±SD of data from five mice per group. * indicates P = .03 when compared with the control group, using a two-sided Student t test. D) Kaplan–Meier Survival Curve of the mice shown in (C). The mean survival times for solvent- and erlotinib-treated mice were both 17.8 days (95% confidence interval [CI] = 14.3 to 21.3 days). The mean survival time for ibrutinib-treated mice was 29.8 days (95% CI = 26.0 to 33.6 days; P = .008 when compared with solvent- or erlotinib-treated mice by log-rank test). All statistical tests were two-sided.
