
Figure 1.
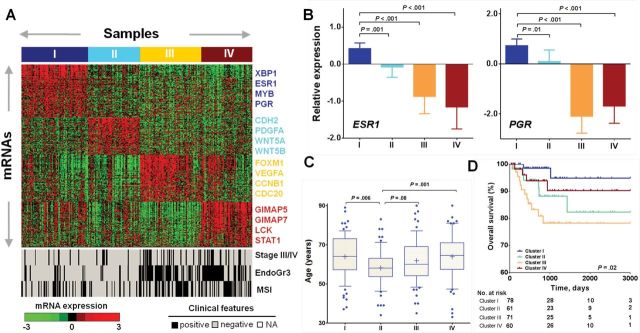
Identification of gene expression subtypes in EEC. A) Consensus clustering of RNAseq profiling identified four gene expression subtypes that were visualized using each respective gene signature (top). Samples were grouped on the basis of subtype predictions. Expression levels for each gene were normalized across the 271 data set such that the mean is zero and the standard deviation is equal to 1. Expression levels greater than the mean are shaded in red, and those below the mean are shaded in green. Clinical features for each sample were illustrated by black cells for stage III/IV or grade 3 or MSI high status, white for stage I/II, or grade 1/2 or MSI low or MSS status (bottom). B) The mRNA expression levels of both estrogen receptor 1 (ESR1) and progesterone receptor (PGR) were statistically significantly higher in Cluster I, as compared with the other three clusters. Data are presented as mean with 95% confidence intervals. The P values were calculated using the Mann Whitney test. C) Cluster II was statistically significantly enriched with patients of younger age. Data are represented as box plots. The central line of each box is the median and edges are the 25th and 75th percentile. The whiskers extend to the 10th and 90th percentile, and data points outside the whiskers are plotted individually as dots. The plus signs indicate the mean values. The P values were calculated using the Mann Whitney test. D) Kaplan-Meier curve demonstrates statistically significant association of the four gene expression clusters with overall survival. All statistical tests were two-sided.