
Figure 2.
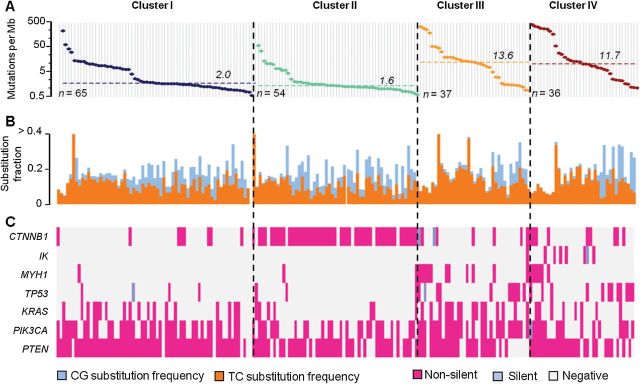
Association of the four EEC subtypes with mutation spectra. A) Genome-wide mutation frequencies (vertical axis) are plotted for each tumor (horizontal axis) in the order of descending mutation frequency within each subtype. The median mutation rate for each subtype was indicated by the dashed line. B) These four clusters were statistically significantly associated with C to G transversion (P < .001) and T to C transition (P = .01). The ratio of C to G nucleotide substitutions to T to C nucleotide substitutions was statistically significantly lower in Cluster III but higher in Cluster II. All statistical tests were two-sided. C) Association of the four gene expression subtypes with somatic mutations showing nonsilent mutations in pink and synonymous mutations in light blue.