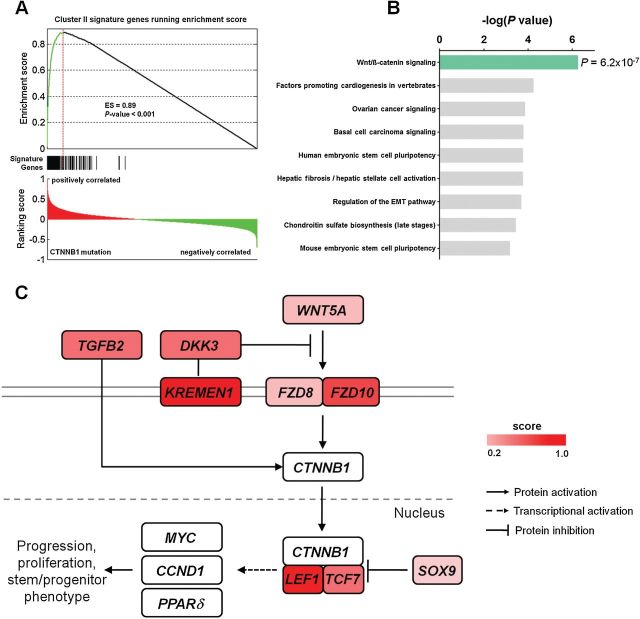
Figure 4.
CTNNB1 mutation association of Wnt/β-catenin signaling in Cluster II. A) Genes differentially expressed between CTNNB1-mutant and CTNNB1 wild-type tumors demonstrate statistically significant positive association by GSEA with the gene expression signature of Cluster II identified in Figure 1. The top portion shows the enrichment score (ES) test of genes associated with CTNNB1 mutation in Cluster II gene signature. The bottom portion shows the ranking scores in the whole genome. The middle portion of the plot shows where the signature genes appear in the raked gene list. B) Pathway analysis performed on 225 genes on the leading edge of the enrichment profile showing statistically significant enrichment of Wnt/β-catenin signaling by Ingenuity Pathway Analysis. P values were calculated using Fisher’s exact test and depicted on a log scale (-log10 P value). C) Schematic representation of the Wnt/β-catenin signaling pathway showing Wnt pathway genes with altered expression level indicated by the color bar. All statistical tests were two-sided.

