
Figure 6.
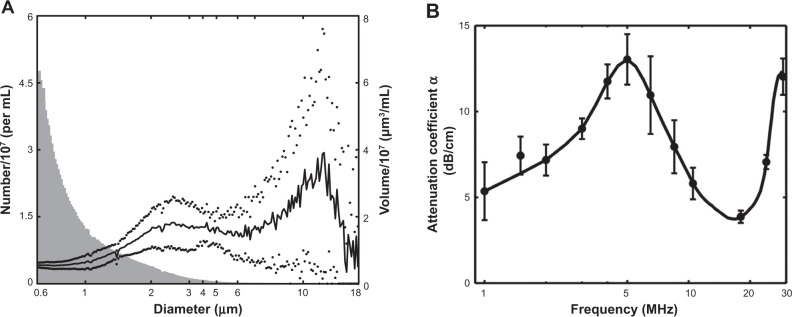
(A) Size distribution (n=3) of the NOBLs, weighted by volume (black) and number density (gray).
Notes: The presence of particles >4 μM (by volume) agrees with Endo-Takahashi et al.34 Dots indicate one standard deviation. (B) Acoustic attenuation as a function of frequency, as determined using the system described in Raymond et al.36