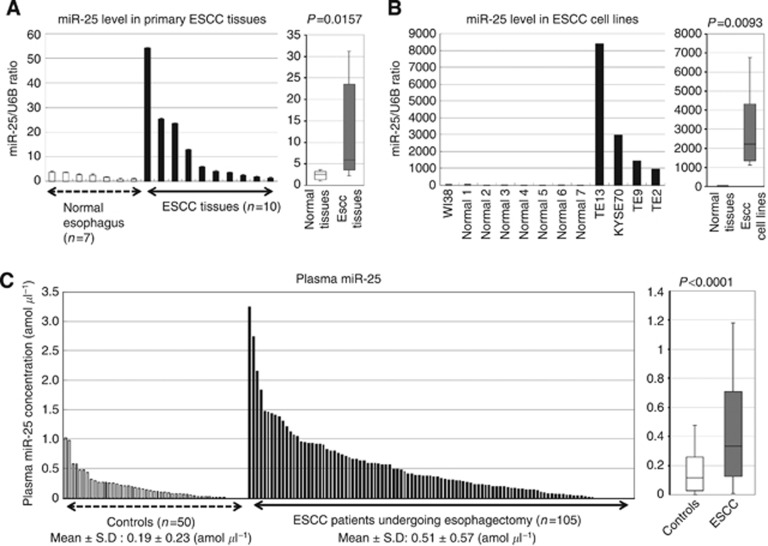
Figure 5.
Evaluation of miR-25 levels in ESCC tissues, ESCC cell lines and plasma samples of patients with ESCC. (A) Difference in miR-25 expression between ESCC tissues and normal tissues determined by a waterfall plot. miR-25 expression levels were significantly higher in ESCC tissues than in normal oesophageal tissues (P=0.0157). The upper and lower limits of the boxes and lines inside the boxes indicate the 75th and 25th percentiles and the median, respectively. The upper and lower horizontal bars denote the 90th and 10th percentiles, respectively. (B) Difference in miR-25 expression between ESCC cell lines, a fibroblast cell line WI-38, and normal tissues. miR-25 expression levels were significantly higher in ESCC cell lines than in both a fibroblast cell line and normal oesophageal tissues (P=0.0093). (C) Plasma miR-25 levels in 105 consecutive ESCC patients and 50 healthy volunteers. Using a real-time RT–PCR assay, difference in plasma miR-25 expression between ESCC patients and normal healthy volunteers was determined by a waterfall plot. Plasma miR-25 levels were significantly higher in ESCC patients than in healthy volunteers (P<0.0001).

