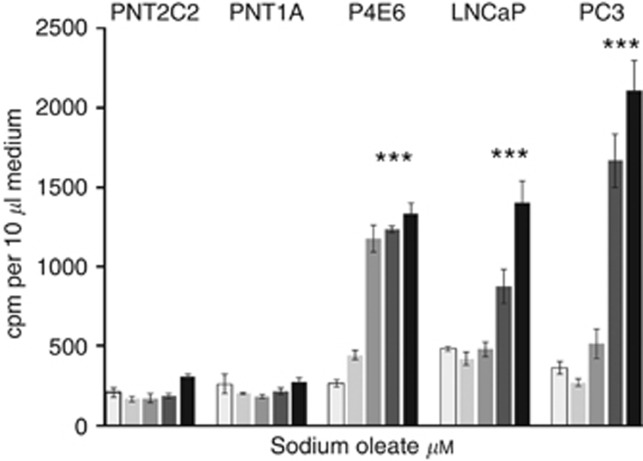
Figure 5.
Etn metabolite release from prostate epithelial cell lines in response to varying NaOL concentrations. Cells were labelled with [1-3H]-Etn as described in Methods. After rinsing, cells were incubated at 37 °C in fresh medium containing 0 (□), 250 ( ), 500 (
 ), 750 (
 ) or 1 mM NaOL (▪) prepared as described. After an hour, 10 μl aliquots of medium were removed for scintillation counting (Methods). Results are means +/−s.d. (n=6). ***P<0.0001 for NaOL effects against basal.

