Abstract
Background:
Colorectal cancer (CRC) progression is associated with suppression of host cell-mediated immunity and local immune escape mechanisms. Our aim was to assess the immune function in terms of expression of TNF, IFNG and FOXP3 in CRC.
Methods:
Sixty patients with CRC and 15 matched controls were recruited. TaqMan quantitative PCR and methylation-specific PCR was performed for expression and DNA methylation analysis of TNF, IFNG and FOXP3. Survival analysis was performed over a median follow-up of 48 months.
Results:
TNF was suppressed in tumour and IFNG was suppressed in peripheral blood mononuclear cells (PBMCs) of patients with CRC. Tumours showed enhanced expression of FOXP3 and was significantly higher when tumour size was >38 mm (median tumour size; P=0.006, Mann–Whitney U-test). Peripheral blood mononuclear cell IFNG was suppressed in recurrent CRC (P=0.01). Methylated TNFpromoter (P=0.003) and TNFexon1 (P=0.001) were associated with significant suppression of TNF in tumours. Methylated FOXP3cpg was associated with significant suppression of FOXP3 in both PBMC (P=0.018) and tumours (P=0.010). Reduced PBMC FOXP3 expression was associated with significantly worse overall survival (HR=8.319, P=0.019).
Conclusions:
We have detected changes in the expression of immunomodulatory genes that could act as biomarkers for prognosis and future immunotherapeutic strategies.
Keywords: expression, DNA methylation, TNF, IFNG, FOXP3, survival
Patients with colorectal cancer (CRC) are likely to be immunosuppressed due to a number of factors including older age (Pawelec et al, 2002) and poor nutritional status (Grunfeld, 2002). However, CRC itself has a direct suppressive effect on the cell-mediated immunity (CMI) as demonstrated by studies showing resolution of normal immunological function after successful tumour resection (Heriot et al, 2000; Galizia et al, 2002). A shift in immune function has been demonstrated in patients with CRC. Decreased total numbers of TH1 CD4+ cells have been found in patients with CRCs (Nakayama et al, 2000). There is also reduced production of cytokines from TH1 lymphocytes(TNF-α and IFN-γ) while those produced by TH2 lymphocytes appear to remain at normal or even elevated levels (O'Hara et al, 1998; Heriot et al, 2000; Shibata et al, 2002; Kanazawa et al, 2005). TNF-α and IFN-γ levels were shown to be particularly low in CRC with vascular invasion (Evans et al, 2010).
Tumour necrosis factor-α (TNF-α) is a TH1 cytokine with both pro- and anti-cancer properties. Multiple experiments have shown that TNF-α produced chronically at low picogram levels in the tumour microenvironment, whether by tumour or stromal cells (or most likely both) may cause direct DNA damage, may have anti-apoptotic or mitogenic activity, may mediate tumour/stromal cell interactions and induce a range of matrix metalloproteinases, cytokines and chemokines that promote tumour development (Balkwill, 2006). Activation of regulatory T cells (Tregs) can cause immunosuppression and has resulted from prolonged exposure to TNF-α (Chen et al, 2007), which could have a cancer promoting effect. On the contrary, in vivo recombinant TNF-α directly injected into tumours destroys the tumour vasculature (Watanabe et al, 1988). Genetically engineered tumour cells producing high levels of TNF-α have been implanted into tumours and, although they do not kill the tumours, they inhibit the growth through the activation of macrophages and natural killer cells (Blankenstein et al, 1991). Heriot et al (2000) have shown a highly significant reduction in production of TNF-α and IFN-γ (interferon-γ) by lipopolysachharide (LPS) stimulated whole-blood cultures derived from patients with CRC as compared to similarly aged controls. They had also shown that suppression of TNF-α and IFN-γ production was higher in late-stage tumours compared to early-stage tumours and this disappears following the resection of tumour. A subsequent follow-up study confirmed that patients who had lower levels of TNF-α and IFN-γ had significantly worse survival (Evans et al, 2006).
T-regulatory cells are implicated in the development of autoimmunity, allergy and rejection of organ transplants, as well as the suppression of immune responses to cancer. There is an increased presence of CD4+CD25+ T cells in a wide spectrum of human malignancies, such as lung, head and neck, ovarian, gastrointestinal and skin. These cells are found in relatively high concentrations in blood, ascites, tumour draining lymph nodes and within the tumour milieu of cancer patients. Regulatory T cells were initially characterised by the CD4+CD25+ phenotype and are thought to modulate the antitumour immune response (Zou, 2006; Curiel, 2007). Depletion of intratumoural Tregs was found to enhance antitumour immunity and tumour rejection in mouse models (Needham et al, 2006). Loddenkemper et al (2006) reported that Treg density in human CRC was lower in node-positive disease but was not associated with survival. However, Ling et al (2007) found no significant difference in Treg density between advanced- and early-stage disease.
The most specific Treg-cell marker identified is the nuclear transcription factor known as FOXP3 (Fontenot et al, 2003; Hori et al, 2003). A high density of tumour-infiltrating FOXP3+ Tregs has been associated with poor outcome in various solid tumours, including ovarian (Curiel et al, 2004; Sato et al, 2005), pancreatic (Hiraoka et al, 2006) and hepatocellular carcinoma (Kobayashi et al, 2007). The expression of FOXP3 in naive CD4+ T cells has been shown to decrease IFN-γ and IL-2 secretion and leads to increased expression of other receptors, which are characteristic of Tregs, such as CD25, glucocorticoid-induced TNF receptor and cytotoxic T Lymphocytic Antigen 4 (Hori et al, 2003). The importance of FOXP3 in functioning Tregs is now well established and is thought to be induced by TCR activation in conjunction with TGF-β stimulation (Coffer and Burgering, 2004). Moreover, FOXP3 expression has also been seen in tumour cells, which may also provide tumours with direct immunosuppressive powers (Hinz et al, 2007; Ebert et al, 2008). The Tregs downregulating tumour-specific immunity is particularly prominent in solid tumours such as colorectal carcinoma (Curiel et al, 2004). FOXP3 expression mediated by cancer cells have been shown to contribute towards disease progression in CRC (Kim et al, 2013). As FOXP3 is a crucial regulator of T regs, compounds that inhibit the expression, function and signalling of FOXP3 might have therapeutic potential.
Published reports from our department have demonstrated the significance of TNF-α and IFN-γ levels in CRC (Heriot et al, 2000; Evans et al, 2006; Evans et al, 2010). In line with the literature (Somasundaram et al, 2002; Wolf et al, 2003) unpublished research in our department has shown increased numbers of Treg cells in CRC. With a view to take these findings forward, our aim was to assess the immune function in terms of the expression of TNF, IFNG and FOXP3 in peripheral blood and tumour of patients with CRC. We also aimed at assessing the influence of DNA methylation on the expression of the study genes, which would be helpful in identifying a potential role for epigenetic regulation in CRC.
Materials and Methods
A total of 60 patients with a diagnosis of colorectal adenocarcinoma were recruited into the study following approval by the local research ethics committee (South West London REC 3, UK). Peripheral blood mononuclear cells (PBMCs) were separated from venous blood using Ficoll–Hypaque density gradient method. Total RNA and DNA were isolated from the PBMCs, fresh frozen tumour tissue and normal mucosa (Qiagen AllPrep DNA/RNA Mini kit and QIAshredder), and simultaneous purification of genomic DNA and total RNA was performed from a single biological sample. The total RNA and DNA extracted from all the samples were analysed for quantity and quality using the NanoDrop spectrophotometer. RNA and DNA extraction were repeated for samples that did not meet the manufacturer's recommendations. The samples that were not satisfactory for either quantity or quality during repeat extraction were excluded from the analysis.
TaqMan quantitative PCR (qRT-PCR, two step) was used to determine the relative fold change in the expression of TNF, IFNG and FOXP3 in the PBMC (compared to controls) and tumour (compared to normal mucosa), with GAPDH as internal control. The total RNA isolated was reverse transcribed into cDNA using the High Capacity cDNA Reverse Transcription kit (Applied Biosystems, Foster City, CA, USA). Predesigned TaqMan Gene Expression Assays (Applied Biosystems) for the test (assay ID: Hs00174128_m1 – TNF, Hs00989291_m1 – IFNG, Hs01085834_m1 – FOXP3) and reference gene (GAPDH) were obtained from Applied Biosystems. Quantitative analysis of the PCR products were performed using the ABI 7500 Fast Real-time PCR system (Applied Biosystems). Relative quantification of gene expression was performed using the 2−ΔΔCt method (Livak and Schmittgen, 2001).
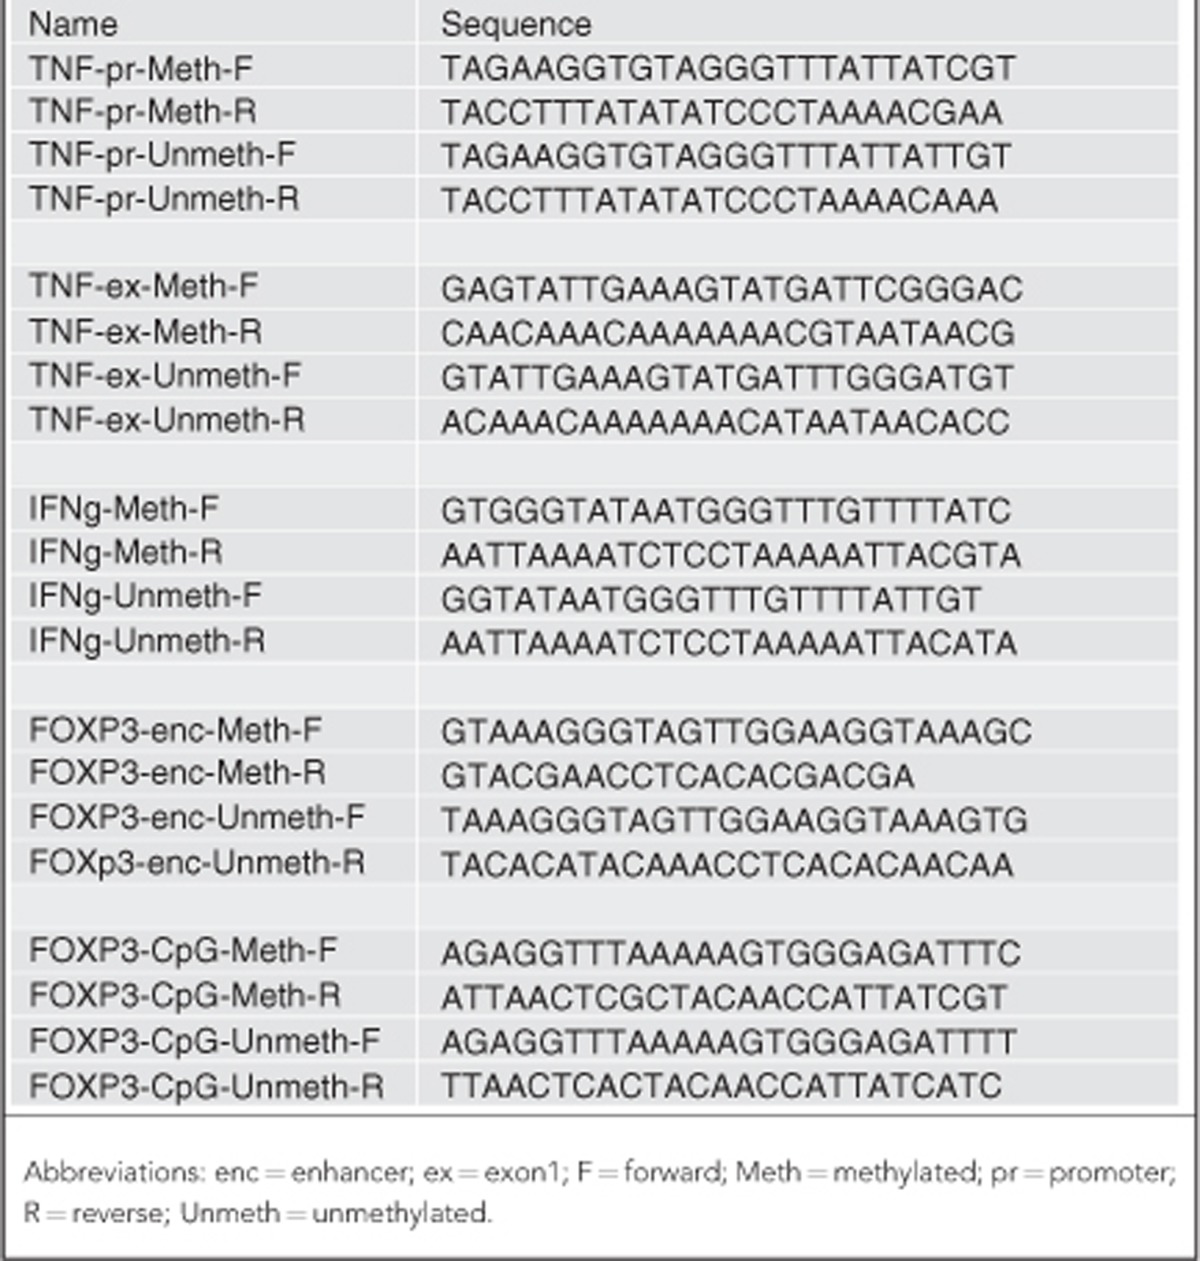
Methylation-specific PCR (MSPCR) was performed to identify the methylation status of the study genes. EZ-96 DNA Methylation-Gold kit (Zymo Research, Irvine, CA, USA) was used for the bisulfite conversion of DNA. Subsequently a multiplex PCR was performed. Each 15 μl MSPCR included 7.5 μl Qiagen Multiplex Master Mix (Qiagen, Hilden, Germany) consisting of HotStarTaq DNA polymerase (Qiagen), multiplex PCR buffer, Mg2+ and dNTPs at optimum concentration; 3 μl Q solution (Qiagen), 0.3 μl each of forward and reverse primers, 2.9 μl of RNAse-free water and 1 μl of bisulfite-converted template DNA. All PCRs were undertaken in 96-well PCR plates (ABgene, Thermo Scientific, Waltham, MA, USA). The PCR conditions were hot-start step of 95°C for 15 min, followed by a 35-cycle programme consisting of 94°C for 60 s, 60°C for 90 s, 72°C for 1 min followed by final 72°C for 10-min extension step. The primer sequences used in the MSPCR are enumerated in Table 1. MSPCR products were analysed on agarose gel electrophoresis. Methyltransferase-treated and -untreated DNA was used as controls for methylated and unmethylated DNA. Samples were defined as methylated or unmethylated depending upon the visual band amplified with methylated or unmethylated primers. Microsatellite instability (MSI) status of the tumour samples were analysed by PCR using microsatellite primers BAT25 and BAT26.
Table 1. The primer sequences used for MSPCR, obtained from Sigma-Aldrich.
The control group included 15 matched patients who attended colorectal clinic with benign colorectal disease and underwent investigations, which ruled out CRC. The control group was used only for the comparison of expression of study genes in PBMC samples. All data analyses were performed using the SPSS 19.0 software (SPSS, Chicago, IL, USA). Pearson's chi-square analysis and Fisher's exact test were employed to compare the difference of categorical variables between patient groups. The relative gene expression levels were compared between various subgroups using Kruskal–Wallis test (>2 groups) and Mann–Whitney U-test (two groups). Survival was analysed according to Kaplan–Meier method. Significance was assumed when the statistical tests returned P-values <0.05.
Results
The study group included 60 patients (32 males, 28 females); 68% (n=41) of patients had left-sided tumours (at or distal to splenic flexure), which were predominantly rectal (n=27). Two patients had synchronous tumours in the rectum and sigmoid colon. The study group included seven patients with recurrent cancers, the sites of which included rectum (n=5), caecum (n=1) and left paracolic space (n=1). Tumour size varied from 5 to 140 mm (mean 44.8, median 38 and s.d. 23.1). Tumour VI was present in 32% (n=18) of our patients and 18% (n=11) had poor differentiation. The TNM staging distribution of patients with primary CRC was – stage 1 (n=9), stage 2 (n=22), stage 3 (n=18) and stage 4 (n=4). Among the patients with recurrent CRC (n=7) the primary staging distribution was – stage 2 (n=3), stage 3 (n=1) and stage 4 (n=3). Supplementary Table 1 enumerates the patient and tumour characteristics.
Gene expression – qRT-PCR
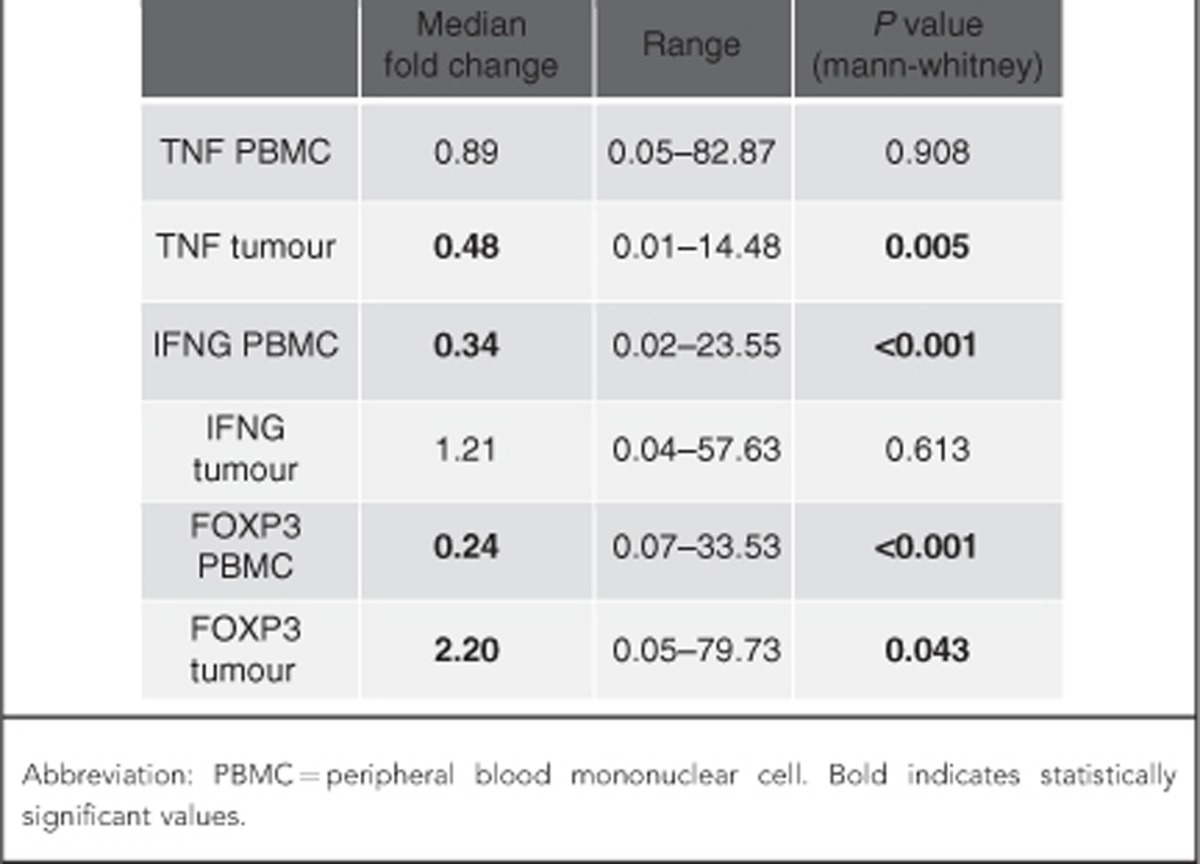
The gene expression levels as measured by the relative quantification method for our study genes are enumerated in Table 2. Gene expression levels are relative to GAPDH expression where GAPDH expression level is equal to 1. Although the median expression levels of the TNF in the PBMC samples were close to reference level (median 0.89), the TNF was found to be suppressed in the tumour samples (median 0.48). On the contrary IFNG was found to be suppressed in the PBMC samples (median 0.34), but the expression levels in the tumour samples were close to the reference level (median 1.21). Although the expression levels of FOXP3 were reduced in the PBMC samples (median 0.24), increased expression was seen with tumour samples (median 2.20).
Table 2. The gene expression levels relative to GAPDH in our study samples.
Gene expression and tumour characteristics
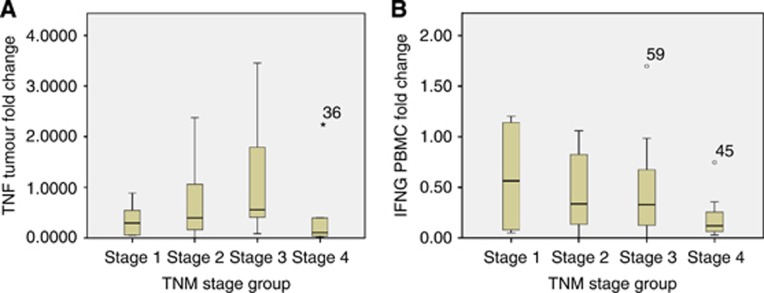
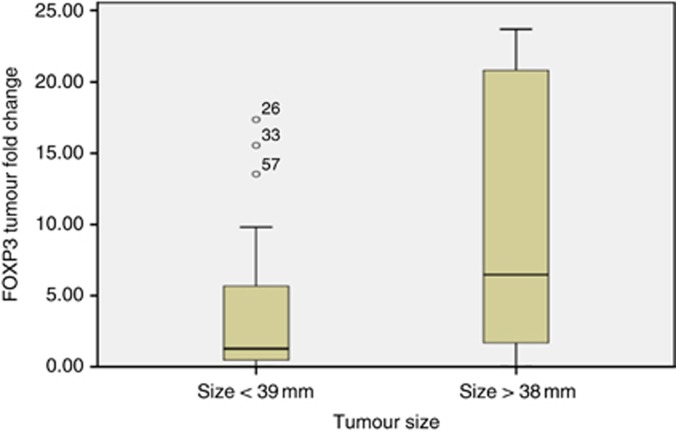
Although the expression of TNF in tumours were suppressed as mentioned above, the suppression was found to be maximum in stage 4 tumours and was statistically significant (P=0.04; Figure 1A). No significant difference was noticed with respect to TNF expression in the PBMC based on stage. However, significant suppression of the PBMC IFNG was noticed in stage 4 tumours (P=0.01; Figure 1B). TNF expression in the tumour samples was significantly high in patients with VI (P=0.034; Supplementary Figure 1). IFNG suppression was significant in the recurrent CRC group compared to the primary CRC group (P=0.01; Supplementary Figure 2). FOXP3 expression in tumours was found to be high in stage 3 tumours, however, the enhanced expression approached but did not reach statistical significance (P=0.06). Although there was an enhanced expression of FOXP3 in tumours, a significantly increased expression was particularly noticed in large-sized tumours (>38 mm, median tumour size=38 mm, P=0.006; Figure 2). A significant positive correlation was noticed in the expression levels of TNF and IFNG in both PBMC (P=0.001) and tumours (P=0.006). The gene expression levels did not have any significant association with grade of CRC.
Figure 1.
(A and B) Levels of TNF and IFNG expression significantly reduced in stage 4 disease in tumour and PBMC samples, respectively (36, 59 and 45 indicate outlier sample numbers).
Figure 2.
Levels of expression of FOXP3 in tumour tissue was significantly enhanced in large tumours (>38 mm, median tumour size) (26, 33 and 57 indicate outlier sample numbers).
DNA methylation and gene expression
Samples were defined as methylated or unmethylated depending upon the visual band amplified with methylated or unmethylated primers (Figure 3). The methylation status and expression levels with respect to the study genes are enumerated in Table 3. TNF methylation was examined at the promoter region and the first exon. TNF expression levels were analysed in the two subgroups (methylated and unmethylated). A significant difference was observed in tumour samples with lower expression found in the methylated group compared to the unmethylated group at both TNFpromoter (P=0.003) and TNFexon1 (P=0.001) sites. The TNF expression in the PBMC samples did not have a significant association with methylation status. The DNA methylation status of TNFpromoter and first exon in both tumours and PBMC did not have any significant association with other pathological prognostic factors.
Figure 3.

Agarose gel electrophoresis demonstrating the MSPCR products for a series of eight tumour samples with TNF methylated primers on the left and TNF unmethylated primers on the right of 100 bp ladder. Although the first seven samples showed methylated product, sample 8 showed unmethylated product. Abbreviations: S1M=sample 1 methylated; S1U=sample 1 unmethylated.
Table 3. The methylation status of samples illustrated at various sites.
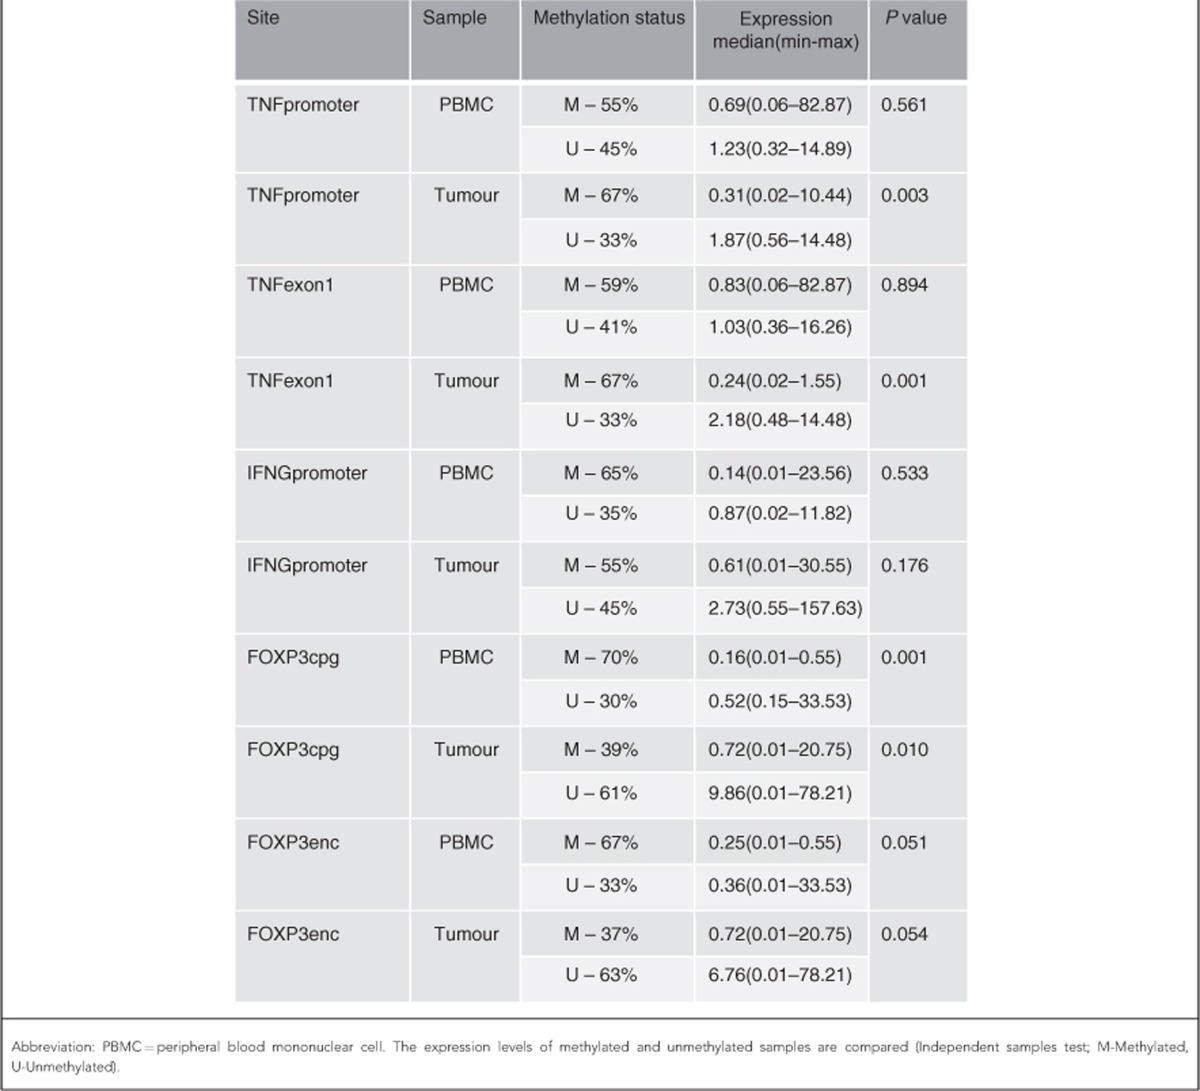
IFNG promoter methylation was observed in 65% of PBMC samples and 55% of tumour samples in patients with CRC. There was no significant difference observed in the expression levels between the methylated and unmethylated groups. There was no significant association between the methylation status of the IFNG and the relative IFNG expression level. The methylation status of IFNG in both PBMC and tumour samples did not have any significant association with any of the pathological prognostic indicators.
FOXP3 methylation was analysed at enhancer and CpG island sites. FOXP3cpg methylation was observed in 70% of PBMC samples and 39% of tumour samples in patients with CRC. FOXP3 relative expression levels were analysed in the two subgroups (methylated and unmethylated). There was a significant difference in the levels of FOXP3 expression with lower expression in the methylated group in both PBMC (P=0.001) and tumour samples (P=0.010). FOXP3enc methylation status was not associated with significant difference in the expression levels. There was no correlation noted with FOXP3 methylation status and tumour size even though the tumour size correlated with relative FOXP3 expression.
Microsatellite instability status, gene expression and DNA methylation
Microsatellite instability status was analysed in 47 patients in our study; 19% (9 of 47, 4 males) of patients in our study were found to have MSI. Although 14% of males with CRC were found to have tumours positive for MSI, 26% of females were found to be positive for MSI. However, the difference was not statistically significant; 9% (4 of 47) were found to have MSI at both BAT25 and BAT26 loci, while the other five patients were positive in either of the two loci. Significant TNF suppression (P=0.002) was noted in the PBMC samples of patients with MSI compared to patients who were microsatellite stable (MSS; Supplementary Figure 3). However, the TNF expression in the tumour samples did not correlate with MSI status. There was no significant difference noted in the expression of IFNG and FOXP3 between MSI and MSS patients. There was also no correlation observed between the MSI status and DNA methylation status of our study genes.
Survival analysis
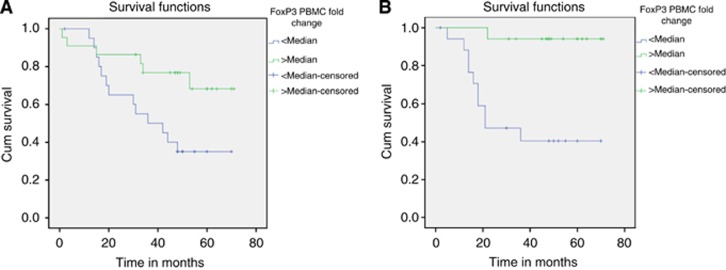
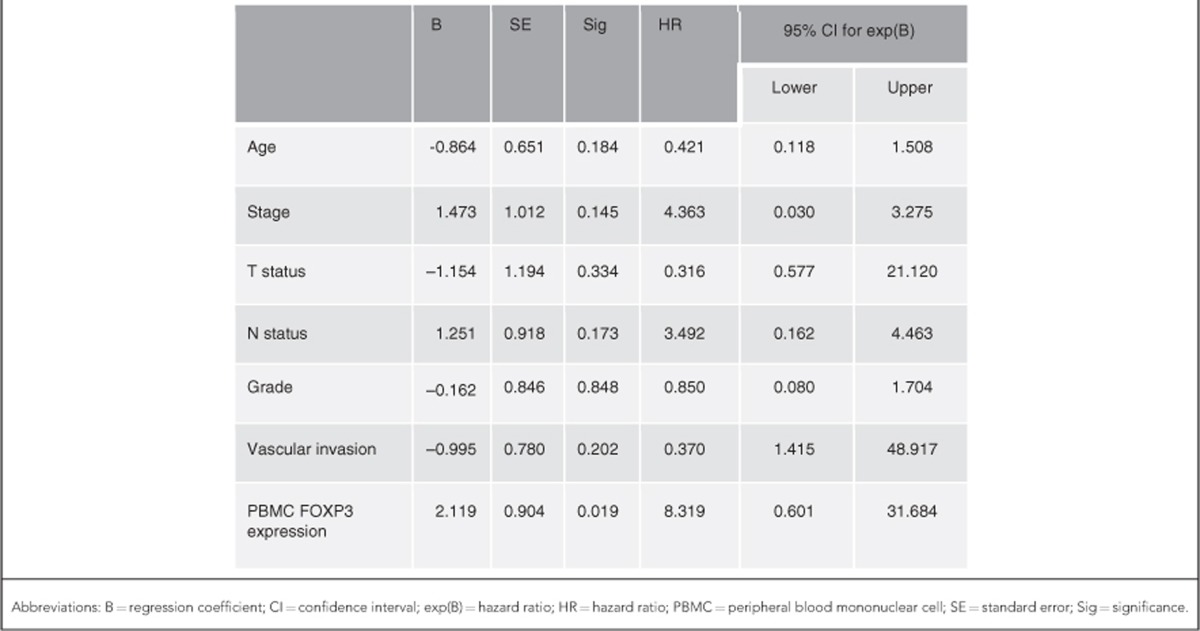
During a median follow-up period of 48 months a total of 23 patients died. Among the patients who underwent curative resection of CRC, 14 patients developed recurrent disease. In order to analyse the survival based on relative gene expression, patients were classified into two groups based on the median expression level. Patients who had higher FOXP3 expression in the PBMC samples had a significantly better overall survival (OS) compared to patients with lower FOXP3 expression (P=0.022, log-rank test; Figure 4A). Similarly, patients with higher PBMC FOXP3 expression had a significantly better recurrence-free survival (RFS, P=0.001; Figure 4B). There was no significant difference in OS and RFS noted with respect to the expression of TNF and IFNG in both PBMC and tumour samples. On multivariate Cox regression analysis (Table 4) PBMC FOXP3 expression was found to be a significant factor influencing the OS (HR=8.319, P=0.019; Supplementary Figure 4) and to a lesser extent the RFS (HR=5.106, P=0.173).
Figure 4.
(A and B) Kaplan–Meier survival curves for OS (P=0.022, A) and RFS (P=0.001, B) in patients classified based on the median expression levels of PBMC FOXP3. Abbreviation: Cum=cumulative.
Table 4. Multivariate Cox regression analysis of various factors influencing the OS.
Discussion
The median expression levels of the genes TNF (median 0.48) and IFNG (median 0.34) were found to be low in the tumour and PBMC samples, respectively. It has been demonstrated in the past that the production of TNF-α and IFN-γ by LPS stimulated whole-blood cultures derived from patients with CRC are reduced as compared to controls (Heriot et al, 2000). It was also shown that the suppression of TNF-α and IFN-γ cytokine production was higher in the late stages than the earlier stages of CRC. In this study, we have shown that the suppression of TNF-α cytokine levels is likely to be due to the suppression of TNF gene in the tumour microenvironment rather than systemic. However, low levels of IFNG expression was noted in the PBMC samples in our study, which indicate that the site of IFNG suppression is likely to be systemic rather than in the tumour microenvironment. Although no specific pattern with TNF and IFNG suppression was noted with respect to stages 1–3 CRC, suppression was found to be statistically significant in stage 4 disease. Although it is possible that immune suppression as represented by the reduced levels of expression of CMI-associated cytokine genes TNF and IFNG could be the reason behind progression of the disease to stage 4, this study is able to establish the correlation but unable to confirm the cause and effect relationship. Similar to stage 4 disease, presentation of patients with recurrent disease following previous resection also represents disease progression. We also noticed that the expression levels of IFNG in the PBMC samples were significantly low in recurrent CRC. The early evidence for antitumour effect of IFNs came from carcinogenesis experiments employing mice that lack IFN-γ, where spontaneous tumour development was more frequent and rapid as compared to wild-type mice. Interferon-γ is an important antiproliferative cytokine that is involved in multiple pathways to check the tumour progression (Brandacher et al, 2006). It is possible that immunosuppression in the form of low IFN-γ levels could have contributed to the recurrence of CRC. We feel that the disease progression in the form of recurrent disease in CRC is likely to be due to the systemic immune suppression as represented by low IFNG expression in PBMC. We have demonstrated a significant positive correlation between the expression of TNF and IFNG, reiterating the fact that both these cytokines act through TH1 pathways that are associated with immune deviation towards enhanced or suppressed tumour rejection based on their activity.
Vascular invasion is seen as one of the discrete steps in the metastatic cascade and results in tumours being capable of shedding millions of tumour cells into the vascular circulation (Liotta et al, 1974). Vascular invasion has been shown to be an independent predictor for haematogenous disease recurrence and decreased survival in CRC (Talbot et al, 1980; Harrison et al, 1994; Petersen et al, 2002; Morris et al, 2006; Quirke and Morris, 2007; Sato et al, 2010). We found that the expression of TNF in tumours was significantly high in the presence of VI. An earlier study found that serum levels of TNF-α was significantly low in the presence of VI (Evans et al, 2010). It is possible that the presence of VI leads to systemic tumour exposure and may explain the significant fall in systemic TH1 cytokine production. Increased expression of TNF in the tumours with VI in our study could be a manifestation of cancer promoting effect of TNF. It is well known that TNF-α is a TH1 cytokine with both pro- and anticancer properties. In prostate cancer, TNF has been shown to enhance the in vitro migration and invasion of tumour cells through increasing the expression of several glycosyl- and sulfo-transferase genes that are involved in the synthesis of mucin-type selectin ligands (Radhakrishnan et al, 2011). As a result, TNF enhanced the entry of tumour cells into the bloodstream.
DNA methylation is an important regulator of gene transcription, and its role in carcinogenesis has been a topic of considerable interest in the last few years. It is currently well known that cancer is characterised by a tremendous amount of epigenetic aberrations, and hence it could be postulated that these aberrations could have an influence on the immune genes in cancer. Hence the DNA methylation status was analysed in our samples in order to correlate it with the expression levels. The significantly lower expression of TNF in methylated tumours illustrates a likely role of DNA methylation in silencing the TNF gene in CRC. Through CRC cell-line experiments Sullivan et al (2007) had shown the possibility of a direct role for DNA methylation in the regulation of TNF-α expression. The influence of DNA methylation on the expression of TNF in human CRC has not been studied in the past. However, we did not find a significant correlation between the methylation status of the IFNG and the relative IFNG expression level. A strong correlation was observed in the DNA methylation status and expression of FOXP3 in both PBMC and tumour samples. With the help of murine experiments Polansky et al (2008)had shown that DNA methylation in T-regulatory cell-specific demethylated region not only regulates FOXP3 gene transcription, but also is critically involved in maintaining stable FOXP3 expression. Hence our finding of a strong correlation illustrates the possible role for DNA methylation in the regulation of FOXP3 in human CRC.
Over the past few decades it has become clear that CRC evolves through multiple pathways and that these pathways can be roughly defined on the basis of molecular patterns such as the integrity of the mismatch repair system or mutational and epigenetic patterns. Tumours with MSI have greater numbers of tumour-infiltrating lymphocytes that are activated and cytotoxic (Phillips et al, 2004) and the lymphocytic reaction is independently associated with longer survival (Ogino et al, 2009). Hence, we classified the patients based on their MSI status in order to observe any difference in the prognosis, gene expression and methylation levels in the two subgroups. In comparison with MSS group, MSI group had a significantly reduced expression of TNF in the PBMC samples. Although the MSI tumours are known to be immunogenic, such a finding has not been reported in the past and could represent a specific form of immune response in CRC. However, DNA methylation and survival did not correlate with MSI status in our study.
A high density of tumour-infiltrating FOXP3+ Tregs has been demonstrated to be associated with a poor outcome in a wide variety of malignancies including CRC (Curiel et al, 2004; Sato et al, 2005; Hiraoka et al, 2006; Kobayashi et al, 2007). Other studies have shown that it may be associated with favourable prognosis (Salama et al, 2009). The T-regulatory cells that are characterised by the expression of FOXP3 have been shown to be capable of inhibiting tumour-associated antigen-specific immune responses in patients with CRC (Clarke et al, 2006). A significantly increased expression of FOXP3 by CRC cells has been demonstrated and was also found to be associated with poor prognosis (Kim et al, 2013). We have demonstrated that the FOXP3 mRNA expression is enhanced in the tumour tissue. The expression was significantly higher in large-sized tumours (classified based on median tumour size). Hence, the expression of FOXP3 can be considered to be associated with tumour growth and hence tumour progression. FOXP3 expression in tumour cells was found to be a strong predictor of metastatic disease and lymph node positivity in a study of human breast cancer patients (Merlo et al, 2009). FOXP3 expression was also found to correlate with stage and lymph node metastasis in oesophageal squamous cancer (Xue et al, 2010). However, a differential expression of FOXP3 in tumour tissue with respect to tumour size has not been demonstrated in the past. In our study, we have also clearly demonstrated that higher FOXP3 expression in the PBMC was associated with significantly better OS and RFS. The significance of its association with better OS was also confirmed on multivariate Cox regression analysis. This finding could add to the prognostic significance of FOXP3 expression in CRC.
Although MSPCR is a rapid and reliable measure of the methylation status in CpG island, the limitation is that it is not quantitative. Having identified a strong association of DNA methylation in the expression of TNF and FOXP3 this could be taken forward by performing quantitative analysis with bisulfite pyrosequencing and demethylation experiments. Increased expression of FOXP3 noted with respect to increasing size of the tumours will need to be confirmed with immunohistochemical studies. Considering the prognostic importance of FOXP3 expression identified in our study further exploration of the canonical pathways of FOXP3 transcription in CRC will be necessary in the future.
Conclusion
Although it is already known that suppression of CMI is a feature in almost all cancers, our study has demonstrated specific alterations in the expression and methylation of CMI-associated immune genes that may offer novel immunomodulatory approaches in the management of CRC. We have demonstrated a possible role for cytokine genes TNF and IFNG in the CRC progression, with specific patterns of suppression noted in stage 4 and recurrent CRC. FOXP3 appears to have a specific role in the progression of the primary tumour due to its association noted with tumour size. We have clearly demonstrated survival benefit in patients with higher PBMC FOXP3 expression. In addition, we have shown that DNA methylation could play an important role in the regulation of TNF and FOXP3. Our novel findings will need further confirmation with the help of quantitative and pathway analyses.
Acknowledgments
The study was funded by the Equipment Committee (Grant no. 3055) at St. George's University of London and the Colorectal Fund at St. George's Hospital, London. We would like to thank Shiyam Nizar for helping with samples.
The authors declare no conflict of interest.
Footnotes
Supplementary Information accompanies this paper on British Journal of Cancer website (http://www.nature.com/bjc)
Ethical approval
South West London Research Ethics Committee (REC) 3, Charing Cross Hospital, London W6 8RF. REC Reference: 09/H0803/84. All persons gave their informed consent prior to their inclusion in the study.
Supplementary Material
References
- Balkwill F. TNF-alpha in promotion and progression of cancer. Cancer Metastasis Rev. 2006;25:409–416. doi: 10.1007/s10555-006-9005-3. [DOI] [PubMed] [Google Scholar]
- Blankenstein T, Qin ZH, Uberla K, Muller W, Rosen H, Volk HD, Diamantstein T. Tumor suppression after tumor cell-targeted tumor necrosis factor alpha gene transfer. J Exp Med. 1991;173:1047–1052. doi: 10.1084/jem.173.5.1047. [DOI] [PMC free article] [PubMed] [Google Scholar]
- Brandacher G, Winkler C, Schroecksnadel K, Margreiter R, Fuchs D. Antitumoral activity of interferon-gamma involved in impaired immune function in cancer patients. Curr Drug Metab. 2006;7:599–612. doi: 10.2174/138920006778017768. [DOI] [PubMed] [Google Scholar]
- Chen X, Baumel M, Mannel DN, Howard OM, Oppenheim JJ. Interaction of TNF with TNF receptor type 2 promotes expansion and function of mouse CD4+CD25+ T regulatory cells. J Immunol. 2007;179:154–161. doi: 10.4049/jimmunol.179.1.154. [DOI] [PubMed] [Google Scholar]
- Clarke SL, Betts GJ, Plant A, Wright KL, El-Shanawany TM, Harrop R, Torkington J, Rees BI, Williams GT, Gallimore AM, Godkin AJ. CD4+CD25+FOXP3+ regulatory T cells suppress anti-tumor immune responses in patients with colorectal cancer. PLoS One. 2006;1:e129. doi: 10.1371/journal.pone.0000129. [DOI] [PMC free article] [PubMed] [Google Scholar]
- Coffer PJ, Burgering BM. Forkhead-box transcription factors and their role in the immune system. Nat Rev Immunol. 2004;4:889–899. doi: 10.1038/nri1488. [DOI] [PubMed] [Google Scholar]
- Curiel TJ. Tregs and rethinking cancer immunotherapy. J Clin Invest. 2007;117:1167–1174. doi: 10.1172/JCI31202. [DOI] [PMC free article] [PubMed] [Google Scholar]
- Curiel TJ, Coukos G, Zou L, Alvarez X, Cheng P, Mottram P, Evdemon-Hogan M, Conejo-Garcia JR, Zhang L, Burow M, Zhu Y, Wei S, Kryczek I, Daniel B, Gordon A, Myers L, Lackner A, Disis ML, Knutson KL, Chen L, Zou W. Specific recruitment of regulatory T cells in ovarian carcinoma fosters immune privilege and predicts reduced survival. Nat Med. 2004;10:942–949. doi: 10.1038/nm1093. [DOI] [PubMed] [Google Scholar]
- Ebert LM, Tan BS, Browning J, Svobodova S, Russell SE, Kirkpatrick N, Gedye C, Moss D, Ng SP, MacGregor D, Davis ID, Cebon J, Chen W. The regulatory T cell-associated transcription factor FoxP3 is expressed by tumor cells. Cancer Res. 2008;68:3001–3009. doi: 10.1158/0008-5472.CAN-07-5664. [DOI] [PubMed] [Google Scholar]
- Evans C, Morrison I, Heriot AG, Bartlett JB, Finlayson C, Dalgleish AG, Kumar D. The correlation between colorectal cancer rates of proliferation and apoptosis and systemic cytokine levels; plus their influence upon survival. Br J Cancer. 2006;94:1412–1419. doi: 10.1038/sj.bjc.6603104. [DOI] [PMC free article] [PubMed] [Google Scholar]
- Evans CF, Galustian C, Bodman-Smith M, Dalgleish AG, Kumar D. The effect of colorectal cancer upon host peripheral immune cell function. Colorectal Dis. 2010;12:561–569. doi: 10.1111/j.1463-1318.2009.01819.x. [DOI] [PubMed] [Google Scholar]
- Fontenot JD, Gavin MA, Rudensky AY. Foxp3 programs the development and function of CD4+CD25+ regulatory T cells. Nat Immunol. 2003;4:330–336. doi: 10.1038/ni904. [DOI] [PubMed] [Google Scholar]
- Galizia G, Lieto E, De Vita F, Romano C, Orditura M, Castellano P, Imperatore V, Infusino S, Catalano G, Pignatelli C. Circulating levels of interleukin-10 and interleukin-6 in gastric and colon cancer patients before and after surgery: relationship with radicality and outcome. J Interferon Cytokine Res. 2002;22:473–482. doi: 10.1089/10799900252952262. [DOI] [PubMed] [Google Scholar]
- Grunfeld C. Leptin and the immunosuppression of malnutrition. J Clin Endocrinol Metab. 2002;87:3038–3039. doi: 10.1210/jcem.87.7.8778. [DOI] [PubMed] [Google Scholar]
- Harrison JC, Dean PJ, el-Zeky F, Vander Zwaag R. From Dukes through Jass: pathological prognostic indicators in rectal cancer. Hum Pathol. 1994;25:498–505. doi: 10.1016/0046-8177(94)90122-8. [DOI] [PubMed] [Google Scholar]
- Heriot AG, Marriott JB, Cookson S, Kumar D, Dalgleish AG. Reduction in cytokine production in colorectal cancer patients: association with stage and reversal by resection. Br J Cancer. 2000;82:1009–1012. doi: 10.1054/bjoc.1999.1034. [DOI] [PMC free article] [PubMed] [Google Scholar]
- Hinz S, Pagerols-Raluy L, Oberg HH, Ammerpohl O, Grussel S, Sipos B, Grutzmann R, Pilarsky C, Ungefroren H, Saeger HD, Kloppel G, Kabelitz D, Kalthoff H. Foxp3 expression in pancreatic carcinoma cells as a novel mechanism of immune evasion in cancer. Cancer Res. 2007;67:8344–8350. doi: 10.1158/0008-5472.CAN-06-3304. [DOI] [PubMed] [Google Scholar]
- Hiraoka N, Onozato K, Kosuge T, Hirohashi S. Prevalence of FOXP3+ regulatory T cells increases during the progression of pancreatic ductal adenocarcinoma and its premalignant lesions. Clin Cancer Res. 2006;12:5423–5434. doi: 10.1158/1078-0432.CCR-06-0369. [DOI] [PubMed] [Google Scholar]
- Hori S, Nomura T, Sakaguchi S. Control of regulatory T cell development by the transcription factor Foxp3. Science. 2003;299:1057–1061. doi: 10.1126/science.1079490. [DOI] [PubMed] [Google Scholar]
- Kanazawa M, Yoshihara K, Abe H, Iwadate M, Watanabe K, Suzuki S, Endoh Y, Takita K, Sekikawa K, Takenoshita S, Ogata T, Ohto H. Effects of PSK on T and dendritic cells differentiation in gastric or colorectal cancer patients. Anticancer Res. 2005;25:443–449. [PubMed] [Google Scholar]
- Kim M, Grimmig T, Grimm M, Lazariotou M, Meier E, Rosenwald A, Tsaur I, Blaheta R, Heemann U, Germer CT, Waaga-Gasser AM, Gasser M. Expression of Foxp3 in colorectal cancer but not in Treg cells correlates with disease progression in patients with colorectal cancer. PLoS One. 2013;8:e53630. doi: 10.1371/journal.pone.0053630. [DOI] [PMC free article] [PubMed] [Google Scholar]
- Kobayashi N, Hiraoka N, Yamagami W, Ojima H, Kanai Y, Kosuge T, Nakajima A, Hirohashi S. FOXP3+ regulatory T cells affect the development and progression of hepatocarcinogenesis. Clin Cancer Res. 2007;13:902–911. doi: 10.1158/1078-0432.CCR-06-2363. [DOI] [PubMed] [Google Scholar]
- Ling KL, Pratap SE, Bates GJ, Singh B, Mortensen NJ, George BD, Warren BF, Piris J, Roncador G, Fox SB, Banham AH, Cerundolo V. Increased frequency of regulatory T cells in peripheral blood and tumour infiltrating lymphocytes in colorectal cancer patients. Cancer Immun. 2007;7:7. [PMC free article] [PubMed] [Google Scholar]
- Liotta LA, Kleinerman J, Saidel GM. Quantitative relationships of intravascular tumor cells, tumor vessels, and pulmonary metastases following tumor implantation. Cancer Res. 1974;34:997–1004. [PubMed] [Google Scholar]
- Livak KJ, Schmittgen TD. Analysis of relative gene expression data using real-time quantitative PCR and the 2(-Delta Delta C(T)) Method. Methods. 2001;25:402–408. doi: 10.1006/meth.2001.1262. [DOI] [PubMed] [Google Scholar]
- Loddenkemper C, Schernus M, Noutsias M, Stein H, Thiel E, Nagorsen D. In situ analysis of FOXP3+ regulatory T cells in human colorectal cancer. J Transl Med. 2006;4:52. doi: 10.1186/1479-5876-4-52. [DOI] [PMC free article] [PubMed] [Google Scholar]
- Merlo A, Casalini P, Carcangiu ML, Malventano C, Triulzi T, Menard S, Tagliabue E, Balsari A. FOXP3 expression and overall survival in breast cancer. J Clin Oncol. 2009;27:1746–1752. doi: 10.1200/JCO.2008.17.9036. [DOI] [PubMed] [Google Scholar]
- Morris M, Platell C, de Boer B, McCaul K, Iacopetta B. Population-based study of prognostic factors in stage II colonic cancer. Br J Surg. 2006;93:866–871. doi: 10.1002/bjs.5345. [DOI] [PubMed] [Google Scholar]
- Nakayama H, Kitayama J, Muto T, Nagawa H. Characterization of intracellular cytokine profile of CD4(+) T cells in peripheral blood and tumor-draining lymph nodes of patients with gastrointestinal cancer. Jpn J Clin Oncol. 2000;30:301–305. doi: 10.1093/jjco/hyd078. [DOI] [PubMed] [Google Scholar]
- Needham DJ, Lee JX, Beilharz MW. Intra-tumoural regulatory T cells: a potential new target in cancer immunotherapy. Biochem Biophys Res Commun. 2006;343:684–691. doi: 10.1016/j.bbrc.2006.03.018. [DOI] [PubMed] [Google Scholar]
- O'Hara RJ, Greenman J, MacDonald AW, Gaskell KM, Topping KP, Duthie GS, Kerin MJ, Lee PW, Monson JR. Advanced colorectal cancer is associated with impaired interleukin 12 and enhanced interleukin 10 production. Clin Cancer Res. 1998;4:1943–1948. [PubMed] [Google Scholar]
- Ogino S, Nosho K, Irahara N, Meyerhardt JA, Baba Y, Shima K, Glickman JN, Ferrone CR, Mino-Kenudson M, Tanaka N, Dranoff G, Giovannucci EL, Fuchs CS. Lymphocytic reaction to colorectal cancer is associated with longer survival, independent of lymph node count, microsatellite instability, and CpG island methylator phenotype. Clin Cancer Res. 2009;15:6412–6420. doi: 10.1158/1078-0432.CCR-09-1438. [DOI] [PMC free article] [PubMed] [Google Scholar]
- Pawelec G, Barnett Y, Forsey R, Frasca D, Globerson A, McLeod J, Caruso C, Franceschi C, Fulop T, Gupta S, Mariani E, Mocchegiani E, Solana R. T cells and aging, January 2002 update. Front Biosci. 2002;7:d1056–d1183. doi: 10.2741/a831. [DOI] [PubMed] [Google Scholar]
- Petersen VC, Baxter KJ, Love SB, Shepherd NA. Identification of objective pathological prognostic determinants and models of prognosis in Dukes' B colon cancer. Gut. 2002;51:65–69. doi: 10.1136/gut.51.1.65. [DOI] [PMC free article] [PubMed] [Google Scholar]
- Phillips SM, Banerjea A, Feakins R, Li SR, Bustin SA, Dorudi S. Tumour-infiltrating lymphocytes in colorectal cancer with microsatellite instability are activated and cytotoxic. Br J Surg. 2004;91:469–475. doi: 10.1002/bjs.4472. [DOI] [PubMed] [Google Scholar]
- Polansky JK, Kretschmer K, Freyer J, Floess S, Garbe A, Baron U, Olek S, Hamann A, von Boehmer H, Huehn J. DNA methylation controls Foxp3 gene expression. Eur J Immunol. 2008;38:1654–1663. doi: 10.1002/eji.200838105. [DOI] [PubMed] [Google Scholar]
- Quirke P, Morris E. Reporting colorectal cancer. Histopathology. 2007;50:103–112. doi: 10.1111/j.1365-2559.2006.02543.x. [DOI] [PubMed] [Google Scholar]
- Radhakrishnan P, Chachadi V, Lin MF, Singh R, Kannagi R, Cheng PW. TNFalpha enhances the motility and invasiveness of prostatic cancer cells by stimulating the expression of selective glycosyl- and sulfotransferase genes involved in the synthesis of selectin ligands. Biochem Biophys Res Commun. 2011;409:436–441. doi: 10.1016/j.bbrc.2011.05.019. [DOI] [PMC free article] [PubMed] [Google Scholar]
- Salama P, Phillips M, Grieu F, Morris M, Zeps N, Joseph D, Platell C, Iacopetta B. Tumor-infiltrating FOXP3+ T regulatory cells show strong prognostic significance in colorectal cancer. J Clin Oncol. 2009;27:186–192. doi: 10.1200/JCO.2008.18.7229. [DOI] [PubMed] [Google Scholar]
- Sato E, Olson SH, Ahn J, Bundy B, Nishikawa H, Qian F, Jungbluth AA, Frosina D, Gnjatic S, Ambrosone C, Kepner J, Odunsi T, Ritter G, Lele S, Chen YT, Ohtani H, Old LJ, Odunsi K. Intraepithelial CD8+ tumor-infiltrating lymphocytes and a high CD8+/regulatory T cell ratio are associated with favorable prognosis in ovarian cancer. Proc Natl Acad Sci USA. 2005;102:18538–18543. doi: 10.1073/pnas.0509182102. [DOI] [PMC free article] [PubMed] [Google Scholar]
- Sato T, Ueno H, Mochizuki H, Shinto E, Hashiguchi Y, Kajiwara Y, Shimazaki H, Hase K. Objective criteria for the grading of venous invasion in colorectal cancer. Am J Surg Pathol. 2010;34:454–462. doi: 10.1097/PAS.0b013e3181d296ef. [DOI] [PubMed] [Google Scholar]
- Shibata M, Nezu T, Kanou H, Abe H, Takekawa M, Fukuzawa M. Decreased production of interleukin-12 and type 2 immune responses are marked in cachectic patients with colorectal and gastric cancer. J Clin Gastroenterol. 2002;34:416–420. doi: 10.1097/00004836-200204000-00006. [DOI] [PubMed] [Google Scholar]
- Somasundaram R, Jacob L, Swoboda R, Caputo L, Song H, Basak S, Monos D, Peritt D, Marincola F, Cai D, Birebent B, Bloome E, Kim J, Berencsi K, Mastrangelo M, Herlyn D. Inhibition of cytolytic T lymphocyte proliferation by autologous CD4+/CD25+ regulatory T cells in a colorectal carcinoma patient is mediated by transforming growth factor-beta. Cancer Res. 2002;62:5267–5272. [PubMed] [Google Scholar]
- Sullivan KE, Reddy AB, Dietzmann K, Suriano AR, Kocieda VP, Stewart M, Bhatia M. Epigenetic regulation of tumor necrosis factor alpha. Mol Cell Biol. 2007;27:5147–5160. doi: 10.1128/MCB.02429-06. [DOI] [PMC free article] [PubMed] [Google Scholar]
- Talbot IC, Ritchie S, Leighton MH, Hughes AO, Bussey HJ, Morson BC. The clinical significance of invasion of veins by rectal cancer. Br J Surg. 1980;67:439–442. doi: 10.1002/bjs.1800670619. [DOI] [PubMed] [Google Scholar]
- Watanabe N, Niitsu Y, Neda H, Sone H, Yamauchi N, Maeda M, Urushizaki I. Cytocidal mechanism of TNF: effects of lysosomal enzyme and hydroxyl radical inhibitors on cytotoxicity. Immunopharmacol Immunotoxicol. 1988;10:109–116. doi: 10.3109/08923978809014405. [DOI] [PubMed] [Google Scholar]
- Wolf AM, Wolf D, Steurer M, Gastl G, Gunsilius E, Grubeck-Loebenstein B. Increase of regulatory T cells in the peripheral blood of cancer patients. Clin Cancer Res. 2003;9:606–612. [PubMed] [Google Scholar]
- Xue L, Lu HQ, He J, Zhao XW, Zhong L, Zhang ZZ, Xu ZF. Expression of FOXP3 in esophageal squamous cell carcinoma relating to the clinical data. Dis Esophagus. 2010;23:340–346. doi: 10.1111/j.1442-2050.2009.01013.x. [DOI] [PubMed] [Google Scholar]
- Zou W. Regulatory T cells, tumour immunity and immunotherapy. Nat Rev Immunol. 2006;6:295–307. doi: 10.1038/nri1806. [DOI] [PubMed] [Google Scholar]
Associated Data
This section collects any data citations, data availability statements, or supplementary materials included in this article.


