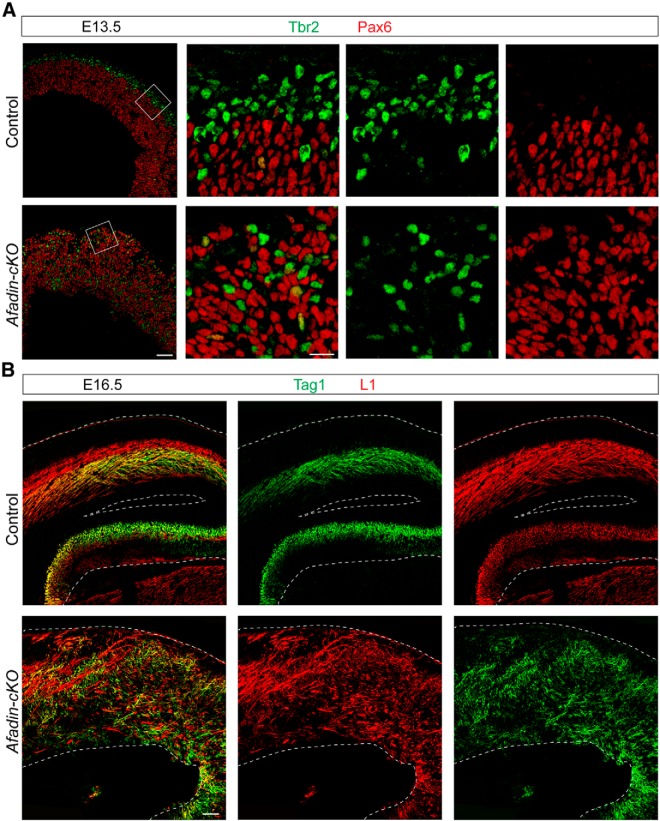
Figure 4.
Progenitor distribution and axonal projections in Afadin-cKO mice. A, Coronal brain sections from control and Afadin-cKO mice at E13.5 were stained with antibodies to Pax6 (red) and Tbr2 (green). Note that the two markers are primarily expressed in non-overlapping cell populations, even in mutant animals. Scale bars: overviews, 100 μm; insets, 25 μm. B, Coronal brain sections from control and Afadin-cKO mice at E16.5 were stained with antibodies to TAG1 (green) and L1 (red) to reveal axonal projections. Note the gross disorganization of axonal tracts in the mutants. Scale bar, 100 μm.

