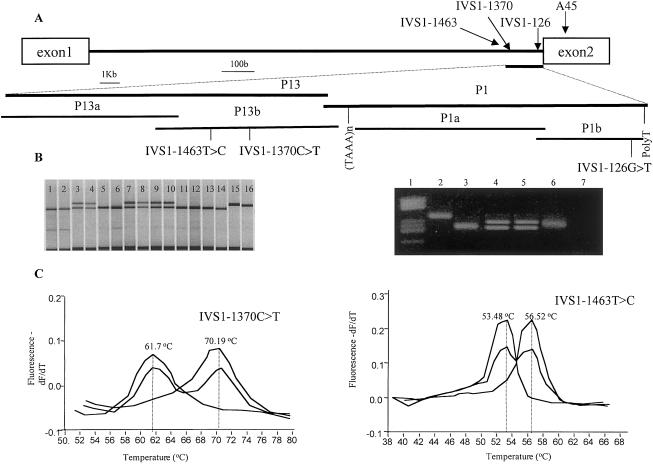
Figure 1.
Characterization of novel SNPs in RET intron 1. A, Schematic representation on 3′ end of intron 1 of the RET proto-oncogene. Codon 45 and the 3 IVS1 SNPs are indicated. B, left panel, genotyping of IVS1-126G→T by fluorescent SSCP. Lanes 1, 2, 5, 6, and 11–14, genotype −/−. Lanes 3, 4, and 7–10, genotype +/−. Lanes 15 and 16, genotype +/+. Right panel, genotyping of IVS1-126G→T by differential restriction with NlaIII. Lane 2, a nondigested sample. Lane 3, genotype −/−. Lanes 4 and 5, genotype +/−. Lane 6, genotype +/+. C, FRET analysis of IVS1-1370C→T and IVS1-1463T→C. In each case, amplicons containing the polymorphisms have a melting point (MP) which is >9°C lower (in the case of IVS1-1370C→T) and 3°C higher (in the case of IVS1-1463T→C) than the amplicons with the wild-type sequence. Genotype −/− , +/−, and +/+ are represented in red, blue, and green, respectively.

