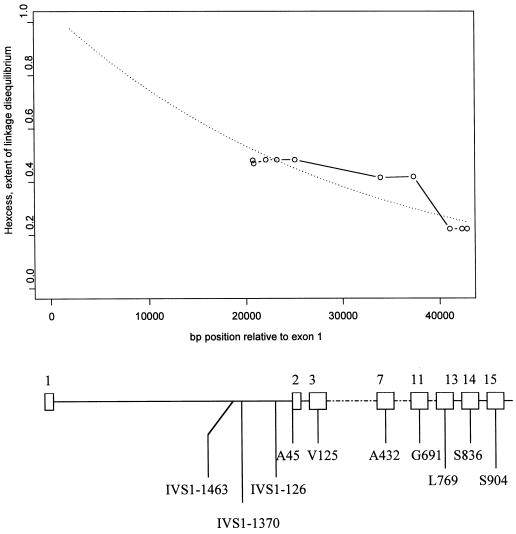
Figure 2.
Excess proportion of ancestral haplotypes among transmitted chromosomes to HSCR patients (see text). The fitted line of expected linkage disequilibrium suggests that the ancestral mutation lies in or near the 5′ region of RET—that is, within intron 1. A schematic of partial RET gene structure on which the positions of the 10 SNPs are placed lies below the plot. Numbers on top of the gene schematic are exon numbers, and the codes below represent the nature and position of the SNPs.

