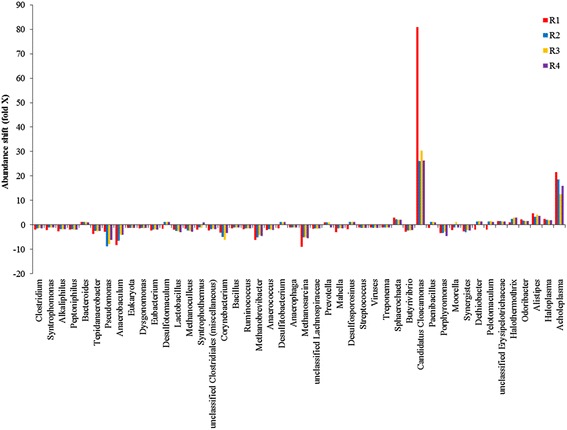
Figure 7.

Abundance shift compared to inoculum at the genus level. This figure shows the fold change in abundant genera (>0.1% in one or more metagenomes) in the reactor samples compared to the inoculum. Fold change values less than 1 were replaced by the negative of their inverse.
