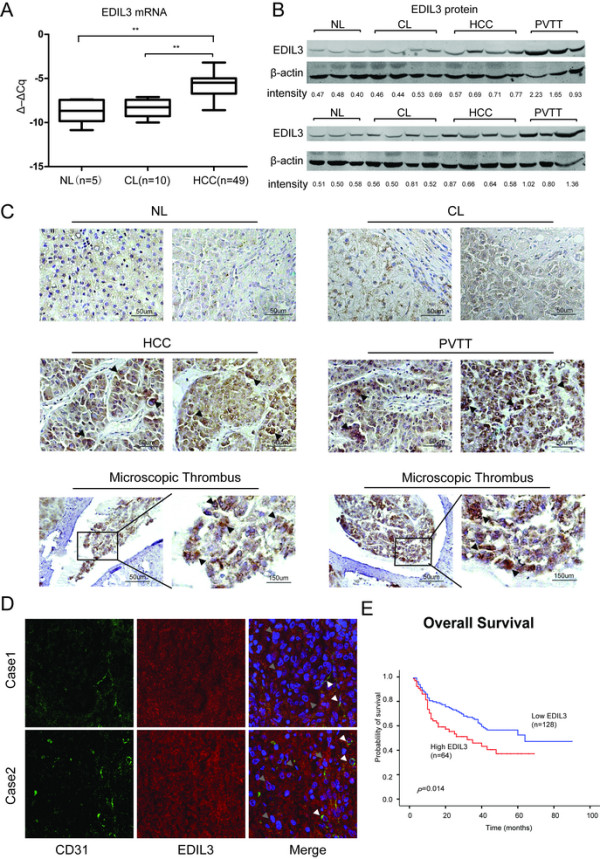
Figure 1.

EDIL3 is significantly up-regulated in HCC and PVTT compared with normal liver (NL) and cirrhotic livers (CL) and is closely related to the prognosis of HCC. A, The transcriptional level of EDIL3 is measured via qRT-PCR in 5 NLs, 10 CLs and 49 HCCs. The relative mRNA level is normalized to β-actin and is presented as Δ–ΔCq. The mRNA of EDIL3 in HCC is significantly higher than both NL and CL; B, The protein level of EDIL3 in NL, CL, HCC and PVTT was examined by western blot with β-actin as a loading control. The EDIL3/β-actin densitometry is performed and shown as density value below. EDIL3 is mildly expressed In NL and CL while significantly elevated in HCC and PVTT; C, Representative pictures demonstrating EDIL3 staining in different liver samples including NL, CL, HCC, PVTT and microscopic thrombi by IHC. Scale bars, 50 μm or 150 μm; Arrow heads indicate that high EDIL3 expression is largely localized to cancer cells. D, Confocal microscopic observation of immunofluorescence staining of CD31 (green), an endothelium marker, and EDIL3 (red) in HCC samples show EDIL3 is not only localized with endothelium, but also widely and diffusively located in cancer cells clusters. White arrows indicates the endothelium; Grey arrows indicates the cancer cell cluster. E, Kaplan-Meier analysis of overall survival between EDIL3-negative or moderately positive patients and highly positive patients shows a significant survival advantage in EDIL3 low express group. **: P < 0.01.
