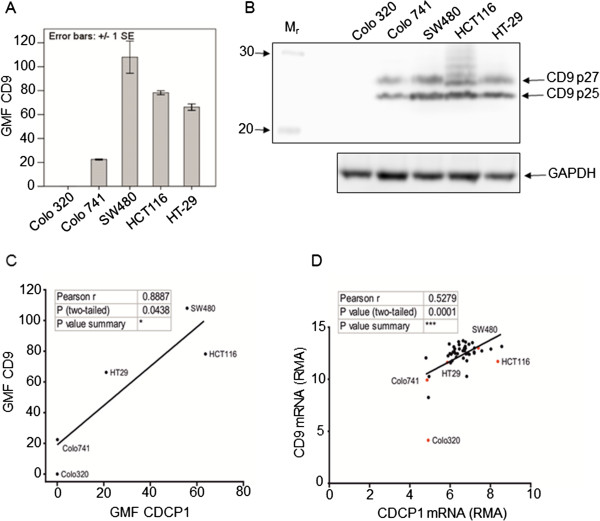
Figure 2.

CDCP1 and CD9 expression in colon cancer cell lines. A) Cell-surface CD9 expression was measured by flow cytometry using monoclonal mouse anti-CD9 clone ALB6. The primary antibody was detected with Alexa488-conjugated goat anti-mouse IgG. Ten thousand cells were gated per sample. Standard error bars are shown. GMF, geometric mean fluorescence. B) Western blot analysis of CD9 expression. Total cell protein (40 μg) in RIPA buffer was separated by SDS-PAGE, transferred to PVDF and CD9 detected using 2 μg/ml mouse monoclonal antibody clone 602–29. Subsequently the PVDF membrane was stripped and re-probed for GAPDH to assess loading. The image is representative of three blots. Arrows indicate the locations of the CD9 species termed p27 and p25. C) An XY plot of the average CDCP1 and CD9 cell surface expression per cell line. A line of best fit was generated by linear regression. There is a significant positive correlation by bivariate Pearson correlation analysis. *p =0.044. GMF, geometric mean fluorescence. D) CDCP1 and CD9 mRNA expression determined by microarray (Robust multi-array average (RMA)) from 47 colon cancer cell lines was downloaded from the Cancer Cell Line Encyclopedia [28]. An XY plot was generated. The cell lines that were experimentally tested for cell-surface CDCP1 and CD9 protein expression are highlighted in red. A line of best fit was generated by linear regression. There is a highly significant positive correlation as reported by a bivariate Pearson correlation analysis. ***p < 0.001.
