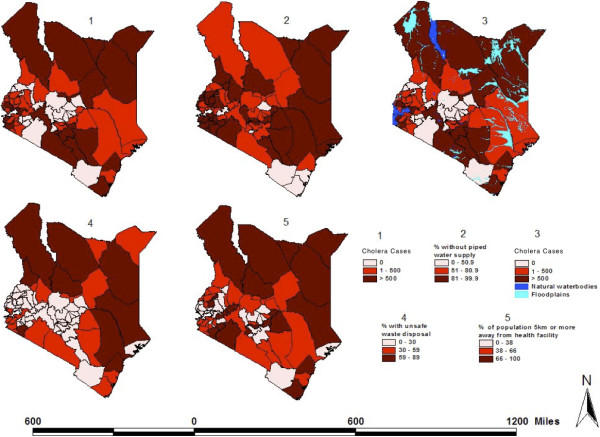
Figure 3.

District-level distribution of cholera cases and various environmental characteristics in Kenya. (1) Combined number of cholera cases reported per district in eight separate years: 1999–2001, 2003, 2005, 2007–2009. (2) Percentage of the population per district without piped water supply. (3) Same as Map 1, plus the distribution of water bodies and flood plains. (4) Percentage of the population per district with unsafe sanitary facilities defined as anything other than flush toilet, ventilated improved pit latrine, or pit latrine. (5) Percentage of the population per district who lives five or more km away from a health facility. Sources: Cholera data: Division of Disease Surveillance and Response. Water bodies and floodplain data: World Resource Institute. All other variables: 2005/06 Integrated Household Budget Survey.
