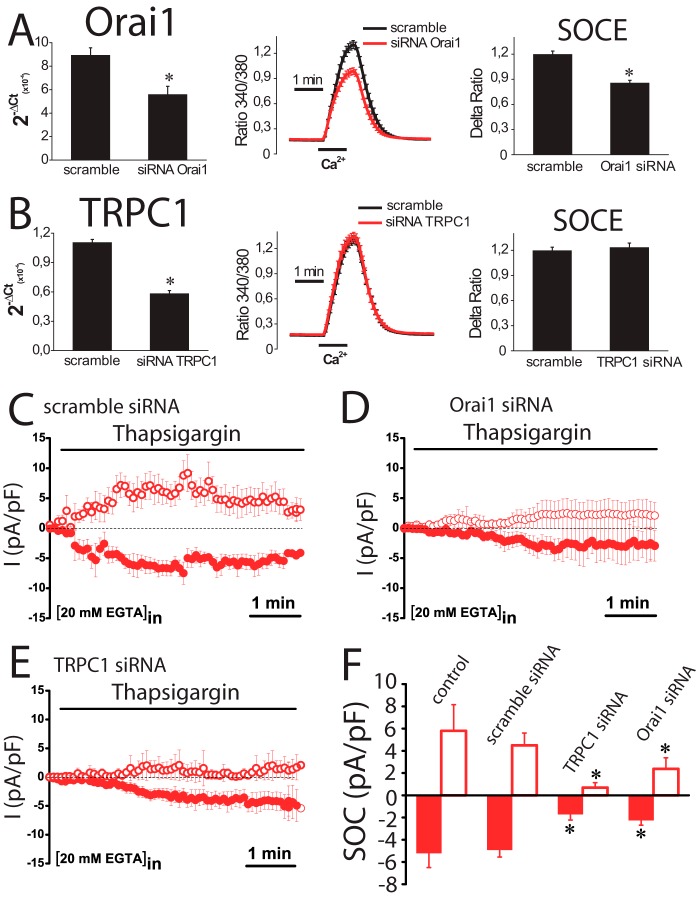
FIGURE 11.
Effects of ORAI1 and TRPC1 knockdown on SOCE and SOCs in colon carcinoma (HT29) cells. A, ORAI1 knockdown inhibits SOCE. Real time PCR of HT29 cells transfected with siRNAs scramble and orai1. Data were normalized to β-actin (mean ± S.E., n = 3, *, p < 0.05). SOCE recordings in HT29 cells transfected with scramble siRNA (black traces) or ORAI1 siRNA. Records are mean ± S.E. (n ≥15). Bars represent the mean ± S.E. of Δ ratios (*, p < 0.05). B, TRPC1 knockdown does not inhibit SOCE. Real time PCR of TRPC1 in HT29 cells transfected with scramble and TRPC1 siRNAs. Data were normalized to β-actin (mean ± S.E., n = 3, *, p < 0.05). SOCE recordings in HT29 cells transfected with scramble siRNA (black traces) or siRNA against TRPC1. Records are mean ± S.E. (n ≥15). Bars represent the mean ± S.E. of SOCE (Δ ratio) (*, p < 0.05). C, average time course plots of ISOC current amplitude from colon cancer cells transfected with scramble siRNA (n = 13). D, average time course plots of ISOC in colon cancer cells transfected with siRNA against ORAI1 (n = 19). E, average time course plots of ISOC in colon cancer cells transfected with siRNA against TRPC1 (n = 17). F, average data obtained from the above experiments (n = 13–19, *, p < 0.05).

