
FIGURE 9.
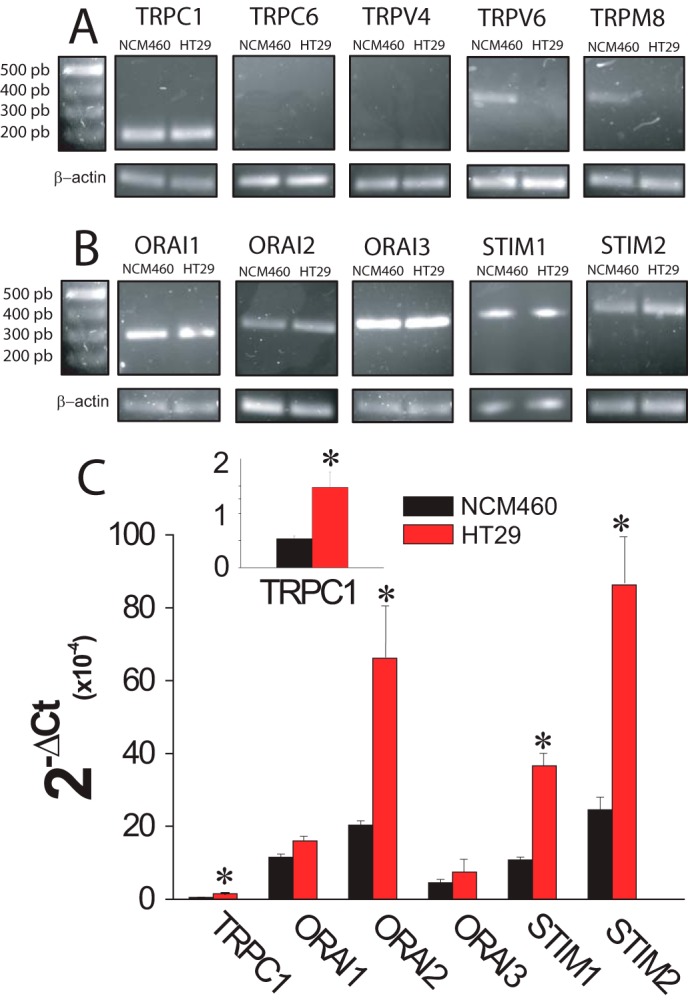
mRNA expression levels of SOCE-related channels and Stim proteins in normal (NCM460) and colon carcinoma (HT29) cells. A, mRNA expression of selected transient receptor potentials in normal and colon carcinoma cells. Pictures show specific bands of RT-PCR products of TRPC1, TRPC6, TRPV6, and TRP8. β-Actin expression was used as internal control. B, mRNA expression of orai and stim family members in normal and colon carcinoma cells. Pictures show specific bands of RT-PCR products of ORAI1, ORAI2, ORAI3, STIM1, and STIM2. β-Actin expression was used as internal control. C, transcript levels of TRPC1, ORAIS, and STIMs. mRNA levels of candidate molecular players were measured in normal (black bars) and tumor (red bars) cells by qPCR and normalized to β-actin. Data are mean ± S.E. of at least three experiments (*, p < 0.05).