
FIGURE 1.
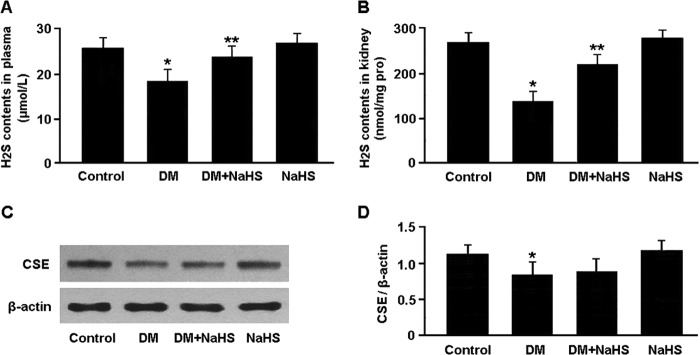
H2S content in plasma (A) and kidney tissue (B) was measured by the methylene blue method. Representative immunoblots (C) and densitometric analysis (D) of CSE are shown. *, p < 0.05 versus control; **, p < 0.05 versus DM (n = 5).
Official websites use .gov
A
.gov website belongs to an official
government organization in the United States.
Secure .gov websites use HTTPS
A lock (
) or https:// means you've safely
connected to the .gov website. Share sensitive
information only on official, secure websites.
H2S content in plasma (A) and kidney tissue (B) was measured by the methylene blue method. Representative immunoblots (C) and densitometric analysis (D) of CSE are shown. *, p < 0.05 versus control; **, p < 0.05 versus DM (n = 5).