
FIGURE 4.
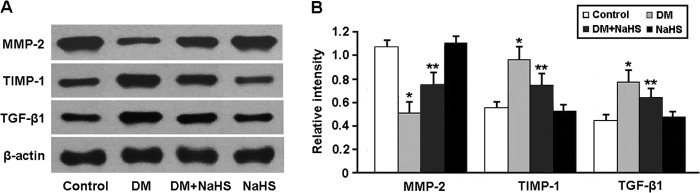
Representative immunoblots (A) and densitometric analysis (B) of MMP-2, TIMP-1, and TGF-β1. *, p < 0.05 versus control; **, p < 0.05 versus DM (n = 5).
Official websites use .gov
A
.gov website belongs to an official
government organization in the United States.
Secure .gov websites use HTTPS
A lock (
) or https:// means you've safely
connected to the .gov website. Share sensitive
information only on official, secure websites.
Representative immunoblots (A) and densitometric analysis (B) of MMP-2, TIMP-1, and TGF-β1. *, p < 0.05 versus control; **, p < 0.05 versus DM (n = 5).