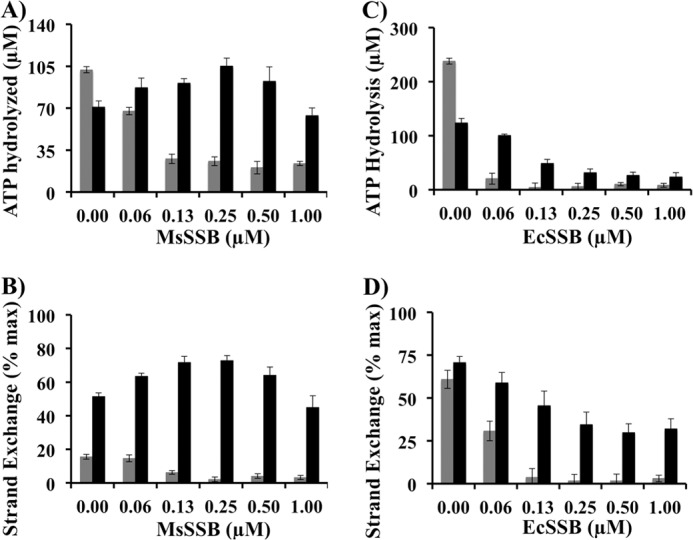
FIGURE 6.

MsSSB partially promotes MsRecA activity in the presence of MsRecOR. A and B, shown are bar graphs representing values of ATP hydrolysis (A) and strand-exchange efficiency (B) by MsRecA (1 μm) at 15 min with ssDNA preincubated with different amounts of MsSSB in buffer C in the absence (gray) or presence (black) of MsRecO (1 μm) and MsRecR (2 μm). C and D, similar bar graphs showing ATP hydrolysis (C) and strand-exchange efficiency (D) by EcRecA (1 μm) upon titration with EcSSB in buffer C in the absence (gray) and presence (black) of EcRecO (1 μm) and EcRecR (2 μm).
