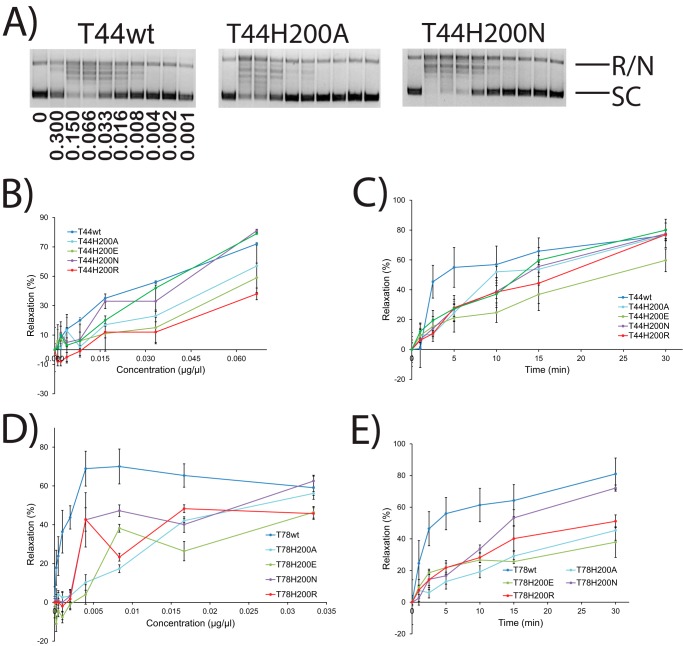
FIGURE 6.
Enzyme concentration gradient and time course experiments with His-200 mutants. A, representative gels showing concentration gradient supercoiled DNA relaxation activity by wild-type Topo-44 and two His-200 mutants. The bands corresponding to fully relaxed or nicked (R/N) and supercoiled (SC) DNA are marked. The concentration of protein (μg/μl) used in each lane is shown in the wild type panel. 0, control with no protein. In all cases, the reaction buffer was at pH 5, and the final volume was 15 μl. B–E, plots showing the percentage relaxation activity versus either protein concentration or incubation times for different His-200 mutants in both the Topo-44 and Topo-78 backbones. The results show that amino acids with different characteristics can be tolerated at position 200, with a preference for positive or neutral residues compared with negatively charged amino acids. The experiments were repeated two times for each mutant. Error bars, S.E. Activity is inhibited at high protein concentrations, and these points were omitted from the analyses. See “Experimental Procedures” for details about how the plots were obtained.

