
FIGURE 3.
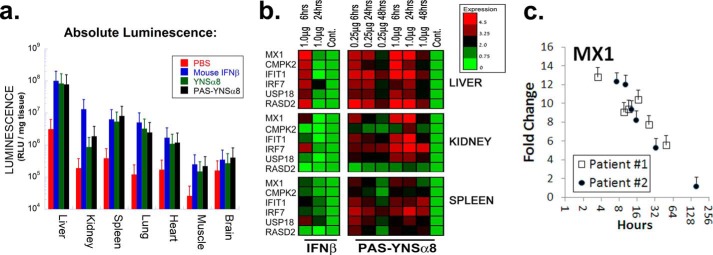
PAS-YNSα8 activates a robust yet distinct IFN-I signaling response in different tissues. a, mice were injected intraperitoneally with 1.0 μg of the indicated type I IFN or with PBS as control. Six hours after the mice were perfused with PBS, tissues were collected for homogenization and measured for luciferase activity. Absolute values of luciferase activity were standardized per unit wet weight for each tissue. Data for non-PASylated IFN-Is were taken from Ref. 24. b, left panels, wild type C57BL/6 mice were injected with 1 μg of Mu-IFNβ. Right panels, HyBNAR homozygous mice were injected with either 0.25 or 1 μg of PAS-YNSα8 (active IFN). Control mice were injected with vehicle (PBS). At the indicated time points, livers, kidneys, and spleens were harvested for RNA extraction and cDNA preparation. qPCR was then performed for a panel of IFN-I response genes as indicated at the left. The results representing log2 fold change (−ΔΔCt) are representative of two animals tested per time point. c, MX1 gene expression levels after single dose IFNβ injection into two human individuals (extracted from a microarray study published elsewhere (29)). Pharmacodynamics of IFNβ injection into humans shows a longer half-life in comparison with mice as expected from the rules of allometric scaling. The error bars represent S.E. from triplicate measurements.