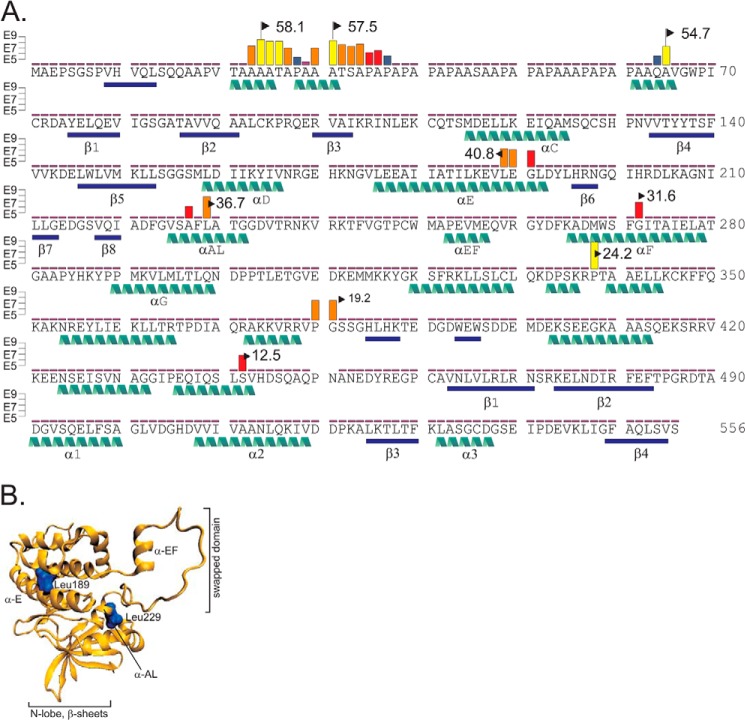
FIGURE 9.
Schematic representation of SPAK cleavage sites. A, the sequence of mouse SPAK is given with β-sheets and α-helices highlighted in blue bars and green helices, respectively. Sites of non-trypsin cleavage identified by mass spectrometry are indicated by vertical colored bars. Integrated peptide intensity levels are indicated by yellow bars (>E8), orange bars (>E7), red bars (>E6), and blue bars (>E5). Calculated sizes of the C-terminal fragments are indicated by a flag. B, schematic of the catalytic domain of SPAK based on OSR1 crystal structure. Secondary structure shows β-sheets and α-helices in orange. The two major sites of cleavage are indicated by bulky blue leucine residues.

