FIGURE 3.
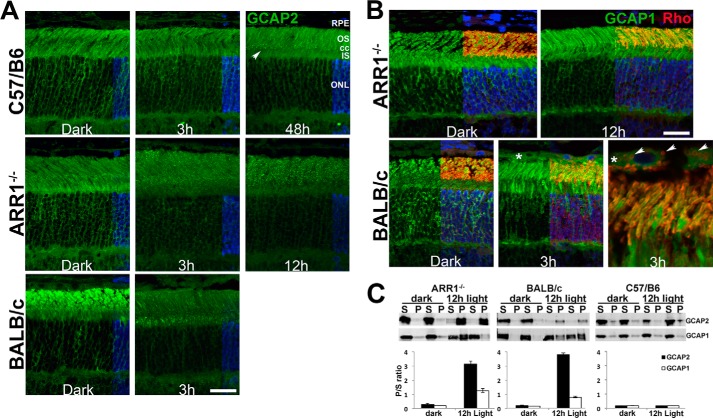
GCAP2 is aggregation prone in the light-exposed retina. A, GCAP2 immunofluorescence (green) is uniformly distributed in the photoreceptor cell layer in retinal sections from dark-adapted C57/B6, ARR1−/−, and BALB/c mice. Following light exposure, brightly staining GCAP2 puncta appeared in the area at the level of the connecting cilium and outer segment layer in the C57/B6 retinal section (48 h, arrow). Puncta appeared earlier in the outer segment layer of ARR1 retinal sections and their number increased with time (3 and 12 h). GCAP2-positive aggregates also appeared in the BALB/c retina after light exposure, although the puncta appeared denser in the inner segment. The location of cell nuclei, visualized by DAPI staining, is shown on the right side of each panel. B, GCAP1 does not form puncta following light exposure. These sections were co-stained with GCAP1 (green), rhodopsin (red), and DAPI (blue). All three signals are shown on the right half of each photomicrograph, whereas the left half shows only GCAP1. In both the ARR1−/− and BALB/c retinas, light damage caused rhodopsin mislocalization to the outer nuclear layer. GCAP1 distribution is unchanged following light exposure in the ARR1−/− retina. Interestingly, GCAP1 (asterisk), as well as rhodopsin-positive vesicles (arrows), appeared in the RPE of BALB/c mice after light damage. os, outer segment; cc, connecting cilium; is, inner segment. Scale bar, 20 μm. C, retinal homogenates from the indicated mice were separated into detergent-soluble (S) and -insoluble fractions (P). The signals were quantified and the P/S ratio is shown in the bar graph (n ≥ 3; error bars, S.E.).

